Download
1 / 58
590 likes | 685 Views
Auditory Perception and Sound Models. Cecilia R. Aragon IEOR 170 UC Berkeley Spring 2006. Acknowledgments. “How the Ear Functions,” http://www.archive.org/details/HowtheEa1940 Brian Bailey, http://www-faculty.cs.uiuc.edu/~bpbailey/teaching/2006-Spring/cs414/index.html

E N D
Auditory PerceptionandSound Models Cecilia R. Aragon IEOR 170 UC Berkeley Spring 2006
Acknowledgments • “How the Ear Functions,” http://www.archive.org/details/HowtheEa1940 • Brian Bailey, http://www-faculty.cs.uiuc.edu/~bpbailey/teaching/2006-Spring/cs414/index.html • Dan Russell, http://www.kettering.edu/~drussell/demos.html • James Hillenbrand, http://homepages.wmich.edu/~hillenbr/AuditoryPerception.ppt • Lawrence Rosenblum, http://www.faculty.ucr.edu/~rosenblu/lab-index.html (McGurk effect) • Andrew Green, http://www.uwm.edu/~ag/teach_pdf/lecturenotes/perception/ IEOR 170
Outline • How the Ear Functions • Physical Dimensions of Sound • Perceptual Dimensions of Sound • Sound Intensity and the Decibel Scale • Pitch Perception • Loudness Perception • Timbre Perception • Digitization of Sound IEOR 170
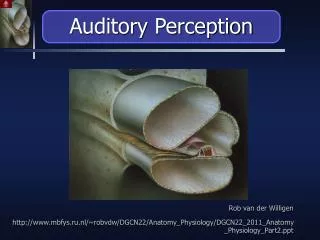
How the Ear Functions http://www.archive.org/details/HowtheEa1940 IEOR 170
Physical Dimensions of Sound IEOR 170
Waves • Periodic disturbances that travel through a medium (e.g. air or water) • Transport energy • “What is a Wave?” Dan Russell, http://www.kettering.edu/~drussell/Demos/waves-intro/waves-intro.html IEOR 170
Sound • A longitudinal, mechanical wave • caused by a vibrating source • Pack molecules at different densities • cause small changes in pressure • Model pressure differences as sine waves IEOR 170
Sound Waves • Pure Tones - simple waves • Harmonics - complex waves consisting of combinations of pure tones (Fourier analysis) - the quality of tone or its timbre (i.e. the difference between a given note on a trumpet and the same note on a violin) is given by the harmonics IEOR 170
Changes in Air Pressure IEOR 170
Process of Hearing (Transduction) IEOR 170
Frequency (temporal) Theory • Periodic stimulation of membrane matches frequency of sound • one electrical impulse at every peak • maps time differences of pulses to pitch • Firing rate of neurons far below frequencies that a person can hear • Volley theory: groups of neurons fire in well-coordinated sequence IEOR 170
Place Theory • Waves move down basilar membrane • stimulation increases, peaks, and quickly tapers • location of peak depends on frequency of the sound, lower frequencies being further away IEOR 170
Physical Dimensions of Sound • Amplitude • height of a cycle • relates to loudness • Wavelength (w) • distance between peaks • Frequency ( λ ) • cycles per second • relates to pitch • λ w = velocity • Most sounds mix many frequencies & amplitudes Sound is repetitive changesin air pressure over time IEOR 170
Perceptual Dimensions of Sound IEOR 170
Auditory Perception Auditory perception is a branch of psychophysics. Psychophysics studies relationships between perception and physical properties of stimuli. Physical dimensions: Aspects of a physical stimulus that can be measured with an instrument (e.g., a light meter, a sound level meter, a spectrum analyzer, a fundamental frequency meter, etc.) Perceptual dimensions: These are the mental experiences that occur inside the mind of the observer. These experiences are actively created by the sensory system and brain based on an analysis of the physical properties of the stimulus. Perceptual dimensions can be measured, but not with a meter. Measuring perceptual dimensions requires an observer (e.g., a listener). IEOR 170
Visual Psychophysics: Physical Properties Perceptual Dimensionsof Light Hue Wavelength Brightness Luminance Shape Contour/Contrast Auditory Psychophysics: Physical Properties Perceptual Dimensionsof Sound Pitch Fundamental Frequency Loudness Intensity Timbre (sound quality) Spectrum Envelope/Amp Env IEOR 170
The Three Main Perceptual Attributes of Sound • Pitch (not fundamental frequency) • Loudness (not intensity) • Timbre (not spectrum envelope or amplitude envelope) The terms pitch, loudness, and timbre refer not to the physical characteristics of sound, but to the mental experiences that occur in the minds of listeners. IEOR 170
Perceptual Dimensions • Pitch • higher frequencies perceived as higher pitch • humans hear sounds in 20 Hz to 20,000 Hz range • Loudness • higher amplitude results in louder sounds • measured in decibels (db), 0 db represents hearing threshold IEOR 170
Perceptual Dimensions (cont.) • Timbre • complex patterns added to the lowest, or fundamental, frequency of a sound, referred to as spectrum envelope • spectrum envelopes enable us to distinguish musical instruments • Multiples of fundamental frequency give music • Multiples of unrelated frequencies give noise IEOR 170
Sound Intensity • Intensity (I) of a wave is the rate at which sound energy flows through a unit area (A) perpendicular to the direction of travel P measured in watts (W), A measured in m2 • Threshold of hearing I0 is at 10-12 W/m2 • Threshold of pain is at 1 W/m2 IEOR 170
Decibel Scale • Describes intensity relative to threshold of hearing based on multiples of 10 IEOR 170
Sound Decibels Rustling leaves 10 Whisper 30 Ambient office noise 45 Conversation 60 Auto traffic 80 Concert 120 Jet motor 140 Spacecraft launch 180 Decibels of Everyday Sounds IEOR 170
Interpretation of Decibel Scale • 0 dB = threshold of hearing (TOH) • 10 dB = 10 times more intense than TOH • 20 dB = 100 times more intense than TOH • 30 dB = 1000 times more intense than TOH • An increase in 10 dB means that the intensity of the sound increases by a factor of 10 • If a sound is 10x times more intense than another, then it has a sound level that is 10*x more decibels than the less intense sound IEOR 170
Loudness from Multiple Sources • Use energy combination equation where L1, L2, …, Ln are in dB IEOR 170
Exercises • Show that the threshold of hearing is at 0 dB • Show that the threshold of pain is at 120 dB • Suppose an electric fan produces an intensity of 40 dB. How many times more intense is the sound of a conversation if it produces an intensity of 60 dB? • One guitar produces 45 dB while another produces 50 dB. What is the dB reading when both are played? • If you double the physical intensity of a sound, how many more decibels is the resulting sound? IEOR 170
Pitch Perception IEOR 170
Pitch and Fundamental Frequency All else being equal, the higher the F0, the higher the perceived pitch. Lower F0, lower pitchHigher F0, higher pitch IEOR 170
Pitch Perception The ear is more sensitive to F0 differences in the low frequencies than the higher frequencies. This means that: 300 vs. 350 ¹3000 vs. 3050 That is, the difference in perceivedpitch (not F0) between 300 and 350 Hz is NOT the same as the difference in pitch between 3000 and 3050 Hz, even though the physical differences in F0 are the same. 300-350: 3000-3050: IEOR 170
Music Perception • Tone height: A sound quality whereby a sound is heard to be of higher or lower pitch; monotonically related to frequency • Tone chroma: A sound quality shared by tones that have the same octave interval • Musical helix: Can help visualize musical pitch IEOR 170
Harmonic Frequencies 1f • Strings or pipes (trombone, flute organ) all have resonant frequencies. • They may vibrate at that frequency or some multiple of it • All instruments and voices carry some harmonics and dampen others 2f1 octave 3f 4f2 octaves 8f3 octaves IEOR 170 Length of string or pipe
Loudness Perception IEOR 170
Loudness and Intensity All else being equal, the higher the intensity, the greater the loudness. Higher intensity, higher loudness Lower intensity, lower loudness IEOR 170
The relationship between intensity and loudness Doubling intensity does not double loudness. In order to double loudness, intensity must be increased by a factor of 10, or by 10 dB [10 x log10 (10) = 10 x 1 = 10 dB]. This is called the 10 dB rule. Two signals differing by 10 dB: (500 Hz sinusoids) Note that the more intense sound is NOT 10 times louder even though it is 10 times more intense. The 10 dB rule means that a 70 dB signal is twice as loud as a 60 dB signal, four times as loud as a 50 dB signal, eight times as loud as a 40 dB signal, etc. A 30 dB hearing loss is considered mild -- just outside the range of normal hearing. Based on the 10 dB rule, how much is loudness affected by a 30 dB hearing loss? (Answer: 1/8th. But note that this does not mean that someone with a 30 dB loss will have 8 times more difficulty with speech understanding than someone with normal hearing.) IEOR 170
Loudness Perception Loudness is strongly affected by the frequency of the signal. If intensity is held constant, a mid-frequency signal (in the range from ~1000-4000 Hz) will be louder than lower or higher frequency signals. 125 Hz, 3000 Hz, 8000 Hz The 3000 Hz signal should appear louder than the 125 or the 8000 signal, despite the fact that their intensities are equal. IEOR 170
Loudness and Pitch • More sensitive to loudness at mid frequencies than at other frequencies • intermediate frequencies at [500hz, 5000hz] • Perceived loudness of a sound changes based on the frequency of that sound • basilar membrane reacts more to intermediate frequencies than other frequencies IEOR 170
Audibility Thresholds IEOR 170
Fletcher-Munson Contours Each contour represents an equal perceived sound IEOR 170
Human Auditory Spectrum • < 20 Hz - infrasound • > 20 KHz - ultrasound • human auditory range decreases with age • TV 17.7 KHz horizontal scanning frequency • “ultrasonic” cleaning devices, burglar alarms (20-40 KHz) • CD 20 KHz cutoff, LP 60-80 KHz IEOR 170
Exposure to Loud Noise IEOR 170
Timbre Perception IEOR 170
Timbre Timbre, also known as sound quality or tone color, is oddly defined in terms of what it is not: When two sounds are heard that match for pitch, loudness, and duration, and a difference can still be heard between the two sounds, that difference is called timbre. For example: a clarinet, a saxophone, and a piano all play a middle C at the same loudness and same duration. Each of these instruments has a unique sound quality. This difference is called timbre, tone color, or simply sound quality. There are also many examples of timbre difference in speech. For example, two vowels (e.g., /å/ and /i/) spoken at the same loudness and same pitch differ from one another in timbre. There are two physical correlates of timbre: spectrum envelope amplitude envelope IEOR 170
Timbre and Spectrum Envelope Timbre differences between one musical instrument and another are partly related to differences in spectrum envelope -- differences in the relative amplitudes of the individual harmonics. In the examples above, we would expect all of these sounds to have the same pitch because the harmonic spacing is the same in all cases. The timbre differences that you would hear are controlled in part by the differences in the shape of the spectrum envelope. IEOR 170
Six Synthesized Sounds Differing in Spectrum Envelope Note the similarities in pitch (due to constant F0/harmonic spacing) and the differences in timbre or sound quality. IEOR 170
Vowels Also Differ in Spectrum Envelope Shown here are the smoothed envelopes only (i.e., the harmonic fine structure is not shown) of 10 American-English vowels.*Note that each vowel has a unique shape to its spectrum envelope. Perceptually, these sounds differ from one another intimbre. Purely as a matter of convention, the term timbre is seldom used by phoneticians, although it applies just as well here as it does in musical acoustics. In phonetics, timbre differences among vowels are typically referred to as differences in vowel quality or vowel color. *From Hillenbrand, J.M, Houde, R.A., Clark, M.J., and Nearey, T.M. Vowel recognition from harmonic spectra. Acoustical Society of America, Berlin, March, 1999. IEOR 170
Aperiodic sounds can also differ in spectrum envelope, and the perceptual differences are properly described as timbre differences. IEOR 170
Amplitude Envelope • Timbre also affected by amplitude envelope • sometimes called the amplitude contour or energy contour of the sound wave • the way sounds are turned on and turned off Leading edge = attack Trailing edge = decay The attack especially has a large effect on timbre. IEOR 170
Music examples(timbre differences related to amplitude envelope) Plucked vs. bowed stringed instruments The damping pedal on a piano The difference in sound quality between a hammered string (e.g., a piano) and a string that is plucked by a quill (e.g., a harpsichord). The timbre differences that distinguish one musical instrument from another appear to be more closely related to differences in amplitude envelope -- and especially the attack -- than to the shape of the spectrum envelope (although both play a role).For example, when the amplitude contour of an oboe tone is imposed on a violin tone, the resulting tone sounds more like an oboe than a violin.* *White, G.D. The Audio Dictionary, 1987, Seattle: University of Washington Press. IEOR 170
Same melody, same spectrum envelope (if sustained), different amplitude envelopes (i.e., different attack and decay characteristics). Note differences in timbre or sound quality as the amplitude envelope varies. IEOR 170
Timbre differences related to amplitude envelope also play a role in speech. Note the differences in the shape of the attack for /b/ vs. /w/ and /S/ vs. /tS/. abrupt attack more gradual attack abrupt attack more gradual attack IEOR 170