Download
1 / 27
280 likes | 405 Views
Auditory Perception. Class 8, Auditory Processing, Part 3. Outline. Oral Presentation Lab 2: Midway point Midterm Q&A class before exam. n/a. Review. How does the ear recover sound intensity loss from the air to water interface in the ear?. Text. Minimum audible field.

E N D
Auditory Perception Class 8, Auditory Processing, Part 3
Outline • Oral Presentation • Lab 2: Midway point • Midterm Q&A class before exam n/a
Review • How does the ear recover sound intensity loss from the air to water interface in the ear? Text
Minimum audible field Minimum audible pressure p 180
Absolute Thresholds • Loudness • A sound cannot be loud • Our perception of the sound can be loud p 181
Conversational speech What’s up here? Absolute Thresholds p 182
Fundamental Concept • Psychometric vs Psychophysical functions • Psychometric • Function of a physical quantity and behaviour • Shows one threshold • Psychophysical • Function of two physical quantities • Shows how threshold on one physical quantity varies as a function of the other n.i.t.
Question • What are these functions? Text
Loudness • Other factors • Spatial integration: Binaural vs monaural presentation accounts for 6 dB difference • Temporal integration: Duration of sound: Threshold increases below 200 ms Text
Fundamental Concept • Spatial and temporal integration • Any sensor must integrate (add up) signals across a certain range of space and time • Longer integration provides greater sensitivity but lower acuity (details are lost) • Recall the idea of “receptive fields” Text
Difference Thresholds • Also vary with frequency • More than that: The Weber fraction also varies with frequency • Weber fraction also varies across intensities • Only constant? Across moderate intensities Text
Difference Thresholds • Increased intensities create greater traveling waves on basilar membrane • Affects more neurons p 185
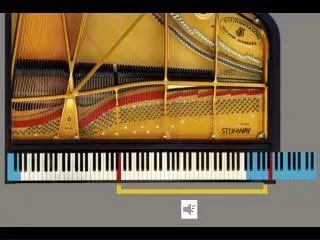
Loudness • Closely related to intensity • Metric of loudness: sone p 186
Masking • How hearing one sound affects the perception of another • Intensity and frequency masking Text
Noise Masking • 2 methods: • Tonal masking Constant target frequency, varying noise frequency • Noise masking Varying target frequency, constant noise frequency Text
Tonal Masking • Fixed test tone, say 1000 Hz at 40 dB • Series of masking tones of different frequencies presented • For each mask, the observer adjusts its intensity until it just drowns out the test tone Text
Tonal Masking • Results shown for 1000 Hz test tone • Most effective mask = same frequency as tone • Masking not symmetric! Text
Noise Masking • Constant mask is used • “Narrow-band” white noise • E.g., noise of 410±45Hz. Centre frequency of 410 Hz and a bandwidth of 90Hz Text
Noise Masking • Effect of 410±45Hz noise mask on the absolute threshold • Done for test tones across frequency spectrum • Threshold most elevated for test tones near the frequency of the noise • Again, not symmetric Text
Masking Asymmetry • How come? • The answer is on the basilar membrane • Characteristics of traveling wave: gradual build-up and sudden decay Text
Perceptually... • Responses to test and masking tones: • more similar if the noise has lower frequency than test • more different if the mask is higher than test frequency Text
Question • If the masking tone or is a 500 Hz, with 50 Hz bandwidth white noise • What frequency target tone will it most effectively mask? • Which target tone will it mask more -- 400 Hz or 600 Hz? • What’s the deal with asymmetry in masking? Text
What is the difference between intensity and loudness? • What are the advantages and disadvantages of open-ear and closed-ear methods for measuring detection thresholds? • What are the psychological and physiological factors that account for the shape of the minimal audibility curve? Text
How is the sone scale defined? • How is the phon scale different? Text
What is the dynamic range of hearing? • Why was the sound of the drill in the other classroom especially annoying? Text