Download
1 / 5

E N D
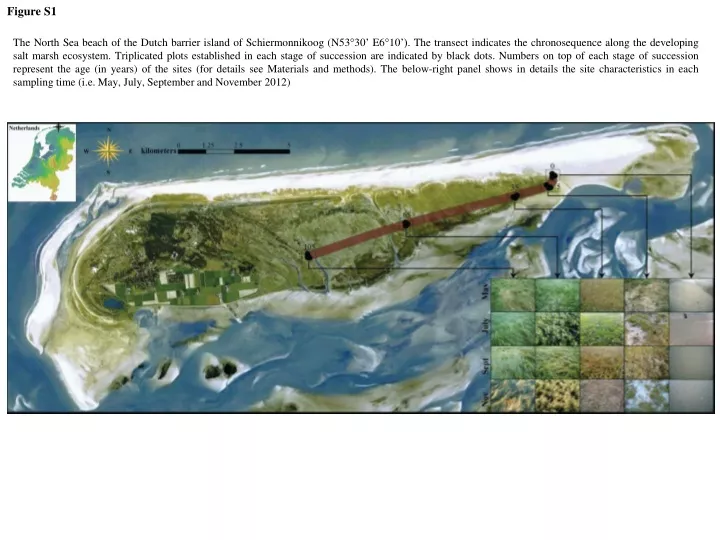
Figure S1 The North Sea beach of the Dutch barrier island of Schiermonnikoog (N53°30’ E6°10’). The transect indicates the chronosequence along the developing salt marsh ecosystem. Triplicated plots established in each stage of succession are indicated by black dots. Numbers on top of each stage of succession represent the age (in years) of the sites (for details see Materials and methods). The below-right panel shows in details the site characteristics in each sampling time (i.e. May, July, September and November 2012)
Figure S2 Bacterial abundance and α-diversity measurements (a) The abundance of bacteria, as indicated by log copies numbers of 16S rRNA gene per gram of dry weight soil, using quantitative PCR (qPCR). Quantifications were performed in triplicate samples collected along the chronosequence at four sampling time (for details see Materials and methods). *P<0.001 (Student’s t-test with 999 Monte Carlo simulations), (b) OTU richness (count of unique OTUs at 97% identity), (c) ChaoI richness estimation, (d) Faith’s phylogenetic diversity (PD) and (e) Shannon’s diversity index; along the chronosequence. Triplicate samples and temporal samples were pooled and the amplitudes of variation within sites are shown at the boxplots. Different letters represent significant differences (P<0.05) at nonparametric t-test with 999 Monte Carlo permutations. Samples colour coding grey, 0 years; blue, 5 years; red, 35 years; green, 65 years; and white, 105 years.
Figure S3 Relative abundance distributions of the classes Alpha- Beta- Delta- and Gamma-proteobacteria within the phylum Proteobacteria, and the phyla Acidobacteria, Actinobacteria, Bacteroidetes, Chloroflexi, Cyanobacteria, Firmicutes, Gemmatimonadetes, Planctomycetes and Verrucomicrobia; along the salt marsh chronosequence. White dots represent average values. Patterns in taxonomic distribution were obtained by quadratic regression, except for the phyla Chloroflexi (linear regression), Cyanobacteria (exponential regression), Acidobacteria and Actinobacteria (non-significant, NS)
Figure S4 Heatmap of Spearman correlations between environmental variables and taxonomical information across sites along the salt marsh chronosequence. Colours represent the rho values of significant Spearman correlations (P<0.05). Non-significant correlations are shown in grey
Figure S5 Pairwise weighted UniFrac distances within sites across four sampling time (i.e. May, July, September and November 2012), visualized on principal coordinates analysis (PCoA) with the percentage of variation explained by each axis noted in parenthesis. PerMANOVA pseudo-F and P-value for temporal effect on β-diversity are reported in the text. Samples colour and coding: up brown triangles, May; red square, July; blue circles, September; and down green triangles, November