Download
1 / 21
210 likes | 306 Views
Mammalian Macroecology in Latin America. Pablo A. Marquet. P. Universidad Cat ólica de Chile Departamento de Ecología Casilla 114 -D, Santiago Chile pmarquet@puc.cl. GOALS Provide an overview of the kind of macroecological patterns so far documented for mammals. EMPHASIS

E N D
Mammalian Macroecology in Latin America Pablo A. Marquet P. Universidad Católica de Chile Departamento de Ecología Casilla 114-D, Santiago Chile pmarquet@puc.cl
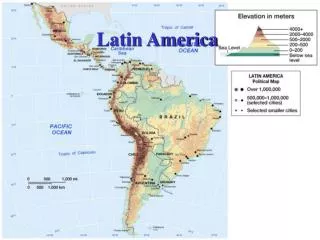
GOALS • Provide an overview of the kind of macroecological • patterns so far documented for mammals • EMPHASIS • Mostly terrestrial, non-volant mammals • South America, Latin America, Neotropics
Macroecology (a working definition) • Macroecology is a research program that aims to • discover the general principles or natural laws underlying • the complexity of ecological systems. To some extent it • proposes a complementary view to the experimental • reductionistic approaches that have dominated • ecology, emphasizing, but not restricted to, • the analysis of large scale statistical patterns • in the distribution and abundance of species at the interface • several scientific disciplines, especially • physiology, ecology, biogeography, and evolution.
Patterns in abundance • Patterns in distribution • Patterns in body size
Patterns in abundance Table.1. Selected analysisi reporting the relationship between abundance and Body size in Norh and South American mammals. T= tropical, fo=frugivore-ommnivores, Io= Insectivore-ommnivore, my =Myrmecophagous. Region habitat slope intercept n Source SA & CA --- -0.70 4.06 40 (0.64) Damuth (1987) NA --- -0.75 4.33 84 (0.66) “ NEOTR. fo T -0.60 3.13 38 (0.38) Damuth (1993) NEOTR. Io T -0.55 2.92 24 (0.40) “ NEOTR. my T -0.81 3.36 6 (0.75) “ NEOTR. T -0.61 3.12 103 (0.45) “
Patterns in abundance • Abundance decreases with body mass • Species at higher trophic levels tend to occur • at lower densities than primary consumers. • Within the Americas mammalian species in • tropical areas tend to occur at lower densities than • extra-tropical species. This pattern have been shown • to hold for Africa, Australia and worldwide (Currie & • Fritz 1993, Fa & Purvis 1997, Johnson 1998).
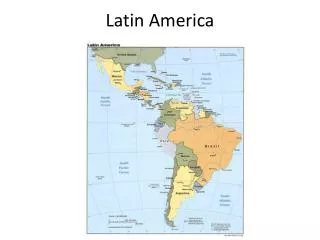
Patterns in distribution • The number of species is not uniformly distributed • across South America. There is a consistent pattern of • an increase in species richness as we go from the poles to • tropical latitudes. • This pattern hold at the species as well as at macrotaxonomic • levels (orders, families, and genera).(Willig and Sandlin 1989, • Willig and Selcer 19889, Ruggiero 1994, Kaufman 1995, • Willig and Gannon 1997, Kaufman and Willig 1998, Willig • and Lyons 1998, Lyons and Willig 1999)
Patterns in distribution • The relationship between richness and latitude is • nonlinear, with several groups of species such as • marsupials, edentates, carnivores, artiodactyls and • hystricognath rodents, reaching maximum • richness in subtropical areas. (e.g., Ruggiero 1994, Willig • and Gannon 1997). • Latitude, but not area, is the best explanatory variable • of the patterns (e.g., Kaufman 1995, Kaufman and Willig • 1998, Lyons and Willig 1999).
Patterns in distribution • The size of species’ geographic ranges vary with latitude. • Geographic ranges tend to be smaller at tropical latitudes • (Rapoport’s rule) (Ropoport 1975, 1982; Anderson and • Koopman 1981, Stevens 1989) • This patterns holds for some taxonomic groups (bats, primates • carnivora) but not for others (edentates, artiodactyls, • hystricognath rodents) (Ruggiero 1994) • Restricted range specie cluster around coastal and Andean • areas (Ruggiero 1994, Ruggiero et al. 1998)
3 2 Number of species 1 Total Endemic 0 Threatened 4 5 6 7 Log Biome Area
Patterns in body size • Body size distributions are highly modal and • right skewed
There is a strong historical signal apparent in the • shape of the distribution, which is related to the origin of • taxa (Marquet and Cofre 1999, Oikos).
Mapping effort currently underway or already implemented in Latin America. Mexico Conabio-Arita
CHILE (Samaniego et al.) Chilean biodiversity mapping • 0.5x0.5 degree grid • Abiotic data incorporated -NDVI & Elevation : http://edcaac.usgs.gov -Pp & Tmp : http://ipcc-ddc.cru.uea.ac.uk -Habitat heterog. : Gajardo (1994).
Latitudinal patterns in Chilean tree, shrub, and vines species richness (Villagran & Hinojosa 1997)