Download
1 / 62
620 likes | 734 Views
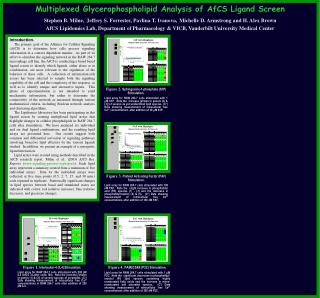
Multiplexed lipid arrays of ligand-induced changes. The Alliance for Cell Signaling 2003 Meeting- Pasadena, CA Lipidomics Laboratory H. Alex Brown, director Vanderbilt University Medical Center. Phospholipid Biosynthetic Pathways. Glycerol-3-phosphate. Dihydroxyacetone phosphate. Choline.

E N D
Multiplexed lipid arrays of ligand-induced changes The Alliance for Cell Signaling 2003 Meeting- Pasadena, CA Lipidomics Laboratory H. Alex Brown, director Vanderbilt University Medical Center
Phospholipid Biosynthetic Pathways Glycerol-3-phosphate Dihydroxyacetone phosphate Choline CK/EK 1-acyl-G-3-P 1-acyl-dhAP Lyso-bis-PA CDP-Choline Choline-P LPA CT PA CPT DGK PC SM LPP CO2 PEMT CDP-DG DG PSD PE PS PSS PI PGp PG EPT Serine Ethanolamine CLS CDP-Ethanolamine PIP Cardiolipin ET PLC PIP2 IP3 + DG Ethanolamine-P PI3K CK/EK PIP3 Ethanolamine
Review of Aims 2002-03 (Lipidomics Lab) Conduct lipid analysis on instrumentation with selective ion scanning capability and at least moderate throughput capacity (greater than 100 samples/week). Construct a working phospholipids fragmentation library for B-lymphocytes (subsequently refocused by Steering Cmte to WEHI-231 cells). Generate new computer program software to achieve computational analysis of mass spectrometry data to detect qualitative changes in membrane lipid composition (cellular lipid analysis program). Initiate LIPID ARRAYS on ligand stimulated WEHI-231 cells. Determine feasibility of measuring poly-phosphatidylinositol species as part of the LIPID ARRAYS.
Identification of lipid species Conduct lipid analysis on instrumentation with selective ion scanning capability and moderate throughput capacity (greater than 100 samples/week).
Electrospray Mass Spectrometry Syringe Pump Tandem Mass Spectrometer Detector Electrospray Ion Source Q1 Collision Cell (Q2) Q3 CID: Monitor product formation in Q3 from a specific parent in Q1 SIM: Monitor specific m/z in Q1 SRM: Monitor transition of a specific m/z in Q1 to a specific product in Q3 D. Hachey
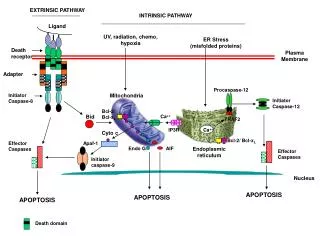
Q3 Q3 Q2 fragmentation Adaptation to triple-quadrupole ESI-MS Collision gas into Q2 electrospray ion beam Q1 Q3 detector Q1 mass spectrum M+ M+ M+frag MS Q2 and Q3 set to allow all ions to pass % M+frag m/z Q2 Q1 M+ M+ M+ daughter fragment ions daughter fragment ions fragmentation M+ M+frag MS2 % M+frag Ar (collison gas) m/z Q1 M+ granddaughter fragment ions M+frag granddaughter fragment ions M+frag % MS3 M+frag Ar m/z A triple-quadrupole ESI mass spectrometer possesses ion selection and fragmentation capabilities. Each quadrupole has a separate function: The first quadrupole (Q1) is used to scan across a preset m/z range or to select an ion of interest. The second quadrupole (Q2), also known as the collision cell, transmits the ions while introducing a collision gas (argon) into the flight path of the selected ion, and the third quadrupole (Q3) serves to analyze the fragment ions generated in the collision cell (Q2). An MS3 experiment can be performed if a daughter fragment ion is generated in electrospray ionization, i.e., M+frag. Q1 can be used to select the daughter ion, Q2 will generate granddaughter fragment ions, and Q3 will mass analyze for the granddaughter fragment ions. (Based on G. Siuzdak, 1996)
Identification of lipid species Positive Mode Fragmentation
732.7 100 95 90 85 80 75 70 760.8 65 60 55 Relative Abundance 50 45 40 35 663.6 563.7 30 730.7 25 786.8 718.7 20 680.6 15 647.6 704.7 788.9 10 585.6 561.7 810.8 468.4 490.4 945.0 5 619.7 813.8 413.3 838.9 966.9 943.0 1076.0 1174.2 994.0 1133.0 0 450 500 550 600 650 700 750 800 850 900 950 1000 1050 1100 1150 1200 m/z ESI+ Up to 135 PLs
732.7 100 95 90 85 80 75 70 760.8 65 60 55 Relative Abundance 733.7 758.8 50 45 40 35 761.8 30 734.7 730.7 25 786.8 718.7 782.7 20 746.7 15 754.7 787.8 768.8 704.7 762.7 780.7 788.9 719.8 706.7 10 735.7 747.8 744.8 770.7 794.8 736.8 772.7 796.8 721.7 748.7 707.7 789.8 5 766.7 774.8 716.7 728.7 708.7 0 700 710 720 730 740 750 760 770 780 790 800 m/z ESI+ Up to 86 PLs
Phosphatidylcholines PC phosphatidylcholine PCe Plasmanyl phosphocholine PCp Plasmenyl phosphocholine
184.1 100 95 90 85 80 75 70 65 60 55 Relative Abundance 50 730.5 45 40 35 30 25 20 15 10 695.2 689.7 5 494.7 614.3 261.0 656.6 529.7 450.3 124.8 219.0 547.4 147.0 391.1 306.4 338.6 735.6 782.7 819.4 859.8 895.5 0 150 200 250 300 350 400 450 500 550 600 650 700 750 800 850 900 m/z Loss of PC headgroup M+1
Phosphatidylethanolamines O C H O 2 R O C H O O C H P O C H C H N H 2 2 2 2 H O C H O 2 R O C H O O C H P O C H C H N H 2 2 2 2 H O C H O 2 R O C H O O C H P O C H C H N H 2 2 2 2 H O PE phosphatidylethanolamine PEe Plasmanyl phosphoethanolamine PEp Plasmenyl phosphoethanolamine
740.4 100 95 90 85 80 75 70 65 60 55 Relative Abundance 50 599.6 45 40 35 30 25 20 15 10 681.3 313.4 184.0 723.2 495.0 555.4 5 295.2 145.2 459.6 332.0 665.5 268.9 754.5 79.1 90.3 848.4 898.1 929.6 1036.4 1101.8 1133.2 0 100 200 300 400 500 600 700 800 900 1000 1100 1200 m/z M+1 Loss of PE headgroup
Identification of lipid species Negative Mode Fragmentation
PI PE PG PS GPA
714.5 100 95 PE 90 85 80 253.4 75 70 65 60 55 281.2 Relative Abundance 50 45 40 35 30 25 20 15 10 478.3 450.2 418.2 306.3 662.5 5 488.8 757.8 539.8 678.7 620.8 582.0 391.1 143.3 729.3 323.2 80.1 98.0 196.1 223.6 771.7 822.9 850.0 883.5 0 100 150 200 250 300 350 400 450 500 550 600 650 700 750 800 850 900 m/z 34:2 PE 16:1 18:1 M-18:1 M-16:1
784.3 100 95 90 85 80 75 70 697.6 65 60 55 Relative Abundance 50 45 40 35 30 25 391.2 20 734.7 15 417.3 441.4 503.0 304.9 752.8 10 281.3 346.1 255.3 479.5 5 528.0 35.0 83.3 153.3 221.0 575.2 652.3 672.4 796.0 851.4 895.6 957.6 997.0 0 100 200 300 400 500 600 700 800 900 1000 m/z 36:3 PS 88 M-88 M-88-16:0 M-88-20:3 18:2 18:1 16:0 20:3
153.0 100 95 90 85 435.4 80 75 70 65 60 55 Relative Abundance 50 45 40 522.4 35 30 281.1 25 492.5 20 195.7 487.6 253.0 15 10 283.3 171.3 237.8 5 63.9 116.3 212.5 331.8 373.9 411.9 530.0 575.8 621.8 677.6 722.7 748.4 796.5 844.7 863.6 0 100 150 200 250 300 350 400 450 500 550 600 650 700 750 800 850 900 m/z M-88 M-88-18:1 18:1 LPS 18:1 M-18:1
909.4 100 95 90 85 80 75 70 65 60 55 Relative Abundance 50 45 40 35 30 25 20 15 283.4 581.0 10 241.1 419.2 599.0 327.1 5 603.3 747.3 463.3 331.4 641.3 417.5 43.3 115.2 152.6 178.3 530.6 700.6 786.6 811.4 905.6 915.9 970.2 0 100 200 300 400 500 600 700 800 900 1000 m/z 40:6 PI 163 259 M-22:6-163 18:0 M-22;6 259-H2O 22:6
Glycerophospholipid Fragmentation Library Construct a working phospholipids fragmentation library for B-lymphocytes (subsequently refocused by Steering Cmte to WEHI-231 cells).
Cellular Lipid Analysis Program Generate new computer program software to achieve computational analysis of mass spectrometry data to detect qualitative changes in membrane lipid composition.
Analysis of Mass Spectrometry Data m/z Peak? Intensity Mass Spectrometer Output Intensity m/z • Peak Identification Process: • Potential Peaks are identified from raw data as possessing a L-H-L pattern. • This list is then parsed to find peaks with an associated “brother peak” 1 Dalton to the right with a smaller intensity. After peaks are identified we compute the Mean and Standard Deviation of the peak Intensity (or a transformation thereof.)
0.493 0.370 Mean -0.023 Analysis of Mass Spectrometry Data Figure 2: Selected transformed peak values in the m/z range of 700 to 725. Figure 1: Raw intensity data from the Mass spectrometer . After the peak list has been compiled the mean and standard deviation for this list is computed. For the current data set these values are: Mean = 44168 SD = 109,724. The peaks are then standardized by calculating the number of deviations they occur above or below the mean. This is a unit-less number, and a peak that has an intensity equal to the mean intensity will receive a score of zero. Note that peaks which occur below the mean will be assigned a negative number. (See Figure 2 for details.) This process is repeated across all time points and repetitions for the basal and agonist conditions.
Analysis of Mass Spectrometry Data The signals are then analyzed on a line by line basis to form a profile for a given m/z value. Below is the data from the m/z value of 706.6 in the basal condition. There are four repetitions in each of 5 time points, 1.5, 3, 6, 15, and 240 minutes. Shewhart Control Chart for m/z = 706.6 Basal Next a Shewhart Control Chart is constructed for the mean of the transformed signal. This chart: • Plots the points with respect to time and the mean within the observational units. • Generates Upper and Lower control limits for the means of the observational units. These limits represent the expected variation within the observed means. (Not individual observations!) • Performs a set of statistical tests looking for “out-of-control” conditions (i.e. non-random variation around the grand mean.) Group Mean T = 15 T = 240 T = 6 T = 1.5 T = 3
Test 2: Two out of three points in Test 3: Four out of five points in Test 1: One point beyond Zone A. a row in Zone A or beyond. a row in Zone B or beyond. Review of Shewhart Control Theory Facts about Shewhart Control Charts: The control limits for the mean are calculated with the formula: s ˆ 3 Where s is the estimate for the population standard deviation and n is the number of repetitions in a group. ± X n The various zones, A, B, and C, are then calculated by dividing the are between the grand mean and the control limits into thirds. The formulas for these zones and the expected percentage of means falling in them are given in the figure to the right. Various statistical tests exist for looking for special cause variation. These include but are not limited to:
Analysis of Mass Spectrometry Data Data from the m/z value 706.6 for 2H3 cells treated with Ionophore. Basal Data Ligand Data The analysis then uses the limits calculated from the basal condition to analyze the stimulated cells. (Assuming the basal data is in control i.e. only random variation present.) The program looks for patterns in the stimulated case using the limits from the basal condition. Out of control points are marked and cataloged as in the figure at the right. Out of Control points. (Rule 2 of 3 in Zone A or beyond) The results of the analysis are then grouped into arrays giving a comprehensive view of time based lipid changes in the cell. T=3 T=15 T=1.5 T=6 T=240
PIP Standards Determine feasibility of measuring poly-phosphatidylinositol species as part of the LIPID ARRAYS.
Poly-phosphatidylinositols PI-3,5-P PI5K PI4K PI-3-P PI-3,4-P PI 4-phosphatase PI3K PI5K PI3K PI 3-phosphatase PI 3-phosphatase PI 5-phosphatase PI4K PI PI-4-P PI-3,4,5-P PI 4-phosphatase PI5K PI 5-phosphatase PI5K PI3K PI 5-phosphatase PI 3-phosphatase PI4K (PTEN) PI-5-P PI-4,5-P PI 4-phosphatase PI3K PI-3,5-P
1045.3 13 965.3 10 1049.7 889.3 1043.3 967.5 1051.2 5 963.5 1019.2 1032.3 995.4 1005.3 890.3 969.3 950.7 915.2 942.3 988.3 928.1 879.3 907.1 971.4 961.6 0 1049.2 72 60 1050.1 40 889.4 20 1051.2 969.4 890.2 1045.3 991.2 1052.4 965.4 971.5 911.3 952.7 1023.3 884.1 1001.1 1006.7 893.2 923.6 939.3 0 1045.4 41 1046.3 30 20 Relative Abundance 1044.3 1047.3 10 965.3 1032.3 1017.4 894.5 967.6 943.4 963.2 1005.1 937.7 993.4 879.0 904.4 923.3 912.2 977.5 0 965.3 100 80 60 966.3 40 967.3 20 937.2 943.3 963.4 915.3 993.4 969.3 878.3 982.3 889.3 904.5 927.9 997.4 1023.4 1009.1 1043.3 1054.2 0 889.3 23 15 890.4 10 885.3 911.2 912.3 5 891.2 919.4 1039.4 900.7 989.2 965.8 1050.0 949.5 998.4 929.3 981.1 1007.6 1014.7 0 880 900 920 940 960 980 1000 1020 1040 m/z Poly-PIP mixture 32:0 PI-3,4,5-phosphate 38:4 PI-4,5-phosphate 38:4 PI-4-phosphate 32:0 PI-3-phosphate
LIPID ARRAYS Initiate LIPID ARRAYS on ligand stimulated WEHI-231 cells.
Relationship of 15 ligands with clear responses inB cells P-protein CD40L, IL4, IL10, INFb AIG, MIP3a, SLC BLC, ELC, SDF1, S1P Calcium cAMP 2MA, PGE2, TER, CGS LPA Sternweis
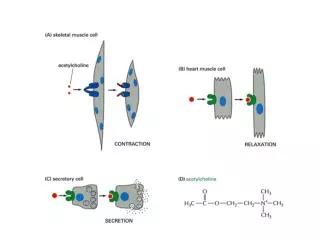
Regulation of B cell activation by antigen-antibody complexes and Ig Fc receptors Antigen-antibody complexes can simultaneously bind to membrane Ig (via antigen) and the FcgRIIB receptor via the Fc portion of the antibody. As a consequence of this simultaneous ligation of receptors, phosphatases associated with the cytoplasmic tail of the FcgRIIB inhibit signaling by the B cell receptor complex and block B cell activation. Fc, crystallizable fragment; FcgRIIB, Fcg receptor II; Ig, immunoglobulin.
Lipid Arrays from WEHI-231 Cells treated with Anti-IgM (ELC030121A – 0219A) Negative Mode Positive Mode
WEHI Cell Lipid Arrays Summary (Negative Mode)
WEHI Cell Lipid Arrays Summary (Positive Mode)
WEHI Cell Lipid Arrays (Negative Mode) Anti-IgM (AIG) CD40 (40L) BLC
WEHI Cell Lipid Arrays (Negative Mode) Anti-IgM (AIG) CD40 (40L) BLC
WEHI Cell Lipid Arrays (Negative Mode) Anti-IgM (AIG) CD40 (40L) BLC
WEHI Cell Lipid Arrays (Negative Mode) Anti-IgM (AIG) CD40 (40L) BLC
LC Class Separation Future Aim: Transition from qualitative to quantitative analysis.
Brugger et al. PNAS, 1997
Phosphatidylcholine Class Separation Varian 240 LC Polymer Labs 1000m ELSD Phenomenex Luna Si column 0.3 mL/min 70%ACN, 20%IPA, 10%H2O, 25mM ammonium formate
732.5 37 30 760.6 25 20 Relative Abundance 15 10 782.5 718.5 5 704.4 408.2 550.7 808.5 822.5 678.4 880.7 522.5 424.3 634.5 934.6 996.6 1137.0 1189.0 1024.9 1110.9 0 563.5 100 90 80 732.4 70 60 50 760.4 40 561.5 30 647.3 535.4 663.4 20 585.4 786.5 944.6 718.4 509.5 801.4 10 812.5 942.6 496.3 961.6 866.7 1000.7 408.1 1041.8 1087.7 1134.7 0 500 600 700 800 900 1000 1100 1200 m/z PC fraction Total Extract
790.3 100 95 90 85 80 75 818.4 70 65 60 55 Relative Abundance 50 816.4 45 776.3 819.4 40 35 30 25 844.4 20 764.3 15 846.4 762.4 10 830.5 750.4 742.4 872.3 886.6 5 627.4 914.5 716.3 694.2 651.3 940.4 1000.6 613.3 956.5 972.3 681.4 0 600 650 700 750 800 850 900 950 1000 m/z PC Fraction +NH4OAc 31-38 min ESI (-)