Download
1 / 78
780 likes | 787 Views
Maps. What is a map?. A Map is a two or three-dimensional model or representation of the Earth’s surface. 2-Dimensional map. What is a “Map Projection”?. Planar Projection. Types of Map Projections.

E N D
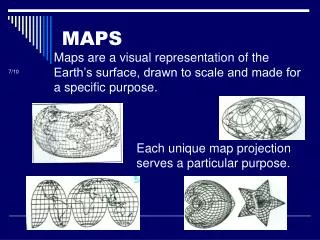
What is a map? A Map is a two or three-dimensional model or representation of the Earth’s surface. 2-Dimensional map
What is a “Map Projection”? Planar Projection
Types of Map Projections All map projections are “flawed” by distortions that are created during “projection”. Different map projections have been developed to reduce this distortion to different areas of the map for different purposes.
Projection A Projection is a mathematical means of transferring information from the Earth’s three-dimensional curved surface to a two-dimensional map.
Gnomonic (Polar) Projection Polyconic Projection Mercator (Cylindrical)Projection Three most common types of map projects are:
Mercator Projection • Strengths: • Shows the entire world on one map • Shows direction as a straight line which makes it good for the • purpose of navigation • True shapes and distances within 15 Degrees of the Equator. • Weakness: • Great Distortion of area and shape at high latitudes.
Gnomonic Projection • Strengths: • Shows the shortest distance between two points • True shapes and distances at the poles. • Weakness: • Great Distortion of area and shape as you move away from • the center point (the lower the degree of latitude the greater the • distortion • Does not show the entire world on one map
Polyconic Projection • Strengths: • Shows true shape and size of landmasses relative to other • landmasses at Mid-Latitudes. • Majority of landmasses fall at Mid-Latitudes • Weakness: • Great Distortion of area and shape as you move away from • Mid-Latitudes • Does not show the entire world on one map
Mercator Projection • Great Distortion of area and shape at high latitudes. • True shapes and distances within 15 Degrees of the Equator.
Robinson Projection • Better balance of size and shape of high latitudes, and low distortion within 45 degrees of the Equator. • Used by National Geographic for world maps since 1988, and replacing Mercator in schools.
Map Distortions Greenland Mercator map size True size of Greenland
In this image, Scandanavia (high lat.) is Larger than India (equatorial).
Latitude and Longitude Where am I? Early Greeks and Chinese attempted to create a grid system to help them answer this question. But it was not until the Middle Ages that the latitude/longitude system was developed.
Latitude and Longitude Cartographers (mapmakers) have established a set of vertical and horizontal grid lines that cover the globe called: Parallels- Lines of Latitude are horizontal lines on a map that show latitude, positions north and south of the equator. Meridians- Lines of Longitude are vertical lines on a map that show longitude, positions east and west of the prime meridian. Because the Earth is a sphere, each line represents a 1 degree slice of the 360 degrees in a the sphere.
The Earth can be divided into vertical and horizontal halves called Hemispheres.
The Equator-Divides Northern and Southern Hemisphere Equator
The Prime Meridian-Divides Eastern from Western Hemisphere. Prime Meridian
Latitude Line “Rules” • Run East to West • Measure distance in degrees from the Equator • Each line forms a circle around the Earth that is vertically equidistant from the equator. • Numbered from 0 to 90 Degrees • (0 being the equator, and 90 being the poles)
Lines of Longitude Prime Meridian
Longitude Line “Rules” • Run North to South • Measure distance in degrees from the Prime- Meridian • Form half-circles that are equidistant from each other at the Equator, but converge at the poles. • 0 Degrees Longitude is at Greenwich, England (established in 1883); 180 Degrees is in the Pacific, and is called the International Date Line • (divides the Globe between two days).
The Degree is the basic unit of Latitude and Longitude A general location on the globe would be shown as 45 N, 75 W. A more precise location on the globe would be 45 15’ 35” N, 75 35’ 15” W.
How “big” is a Degree? Each degree in Latitude and Longitude is approximately 69 miles “wide” at the equator. Each degree can be divided into 60 subdivisions called minutes(1.15 miles in “width”). 45’ Each minute can be divided into 60 subdivisions called seconds (.019 miles, or 100 feet!). 35” So, your location on the globe can be very precisely identified, and would look like this: 97 35’ 42” W.
Every spot on Earth has an address that is determined by referencing, in degrees, minutes and seconds, the latitude and longitude of that location.
Global Positioning System (GPS) • GPS is a system of satellites and receivers that allow for accurate positioning on the Earth. • Consists of three parts: Ground control,satellites,and receivers • Allows for determining location,speed,and distance. GPS Ground Receivers GPS Satellites
Map Scale Map Scale expresses the relationship between the distance on a map and the true, corresponding distance of the same area of the Earth’s surface. Mapmakers can't draw maps the same size as the area they represent; the maps would be too big. So they draw features smaller than they actually are.
A map scale is usually given as a fraction (1/10000) or a ratio (1:10000) called a fractional scale USGS maps contain scales that have the same units on both sides of the ratio. Fractional scale
Bar Scale A bar scale is just a line drawn on a map of known ground length. There are usually distances marks along the line. Bar scales allow for quick visual estimation of distance.
Pay attention to where the zero point on the bar actually is when you measure with a bar scale! Notice that 0 is here!
Map Orientation • A compass is usually used to determine cardinal direction • A compass does not normally point to Geographic- North (True North) • Magnetic North and Geographic- North (True North) are only the same in very few places. • The direction in which the compass needle points is called Magnetic North, and the angle between magnetic north and true north is called Magnetic Declination.
Declination or Degrees Off Course Effect of Magnetic Declination Error Off Target after Walking 10 Miles 1° 920 feet (280meters) 5° 4,600 feet (1,402 meters) 10° 9,170 feet (2,795 meters)
Topographic Maps Topographic Maps
-A Topographic Map is the representation, normally on a flat surface, of part of the Earth’s surface, drawn to scale.-Topographic maps show distance relationships and elevation-Topography actually means, “the shape, elevation and slope of the land”.
Topographic Maps Different symbols and colors are used to indicate various features on topographic maps, including bodies of water and human-made structures. A topographic map of Portland, Maine shows various physical features of the area.
Topographic maps also include symbols that represent such features as woods, houses and roads. House Woods Streams Roads
- The distinctive characteristic of a Topographic Map is that the shape of the Earth’s surface is shown by contour lines.- Contour Lines are imaginary lines that join points of equal elevation on the land above or below sea level.-How do we know where to put the lines when we make a map???
We could start with an island, and increase the level of the ocean the amount of our contour interval, an marking the shore line as we raise the water level.
10 feet above normal sea-level Notice that the shape of the island changes. Why?