Download
1 / 28
280 likes | 288 Views
Laser Fringe Stabilization of 35nm IP Beam Size Monitor (Shintake monitor) for ATF2/ILC. Taikan SUEHARA The University of Tokyo. Contents. About ATF2 and Shintake-monitor Shintake-monitor uses laser fringe to obtain beam size

E N D
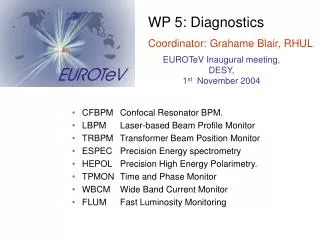
Laser Fringe Stabilization of 35nm IP Beam Size Monitor(Shintake monitor) for ATF2/ILC Taikan SUEHARA The University of Tokyo
Contents • About ATF2 and Shintake-monitor • Shintake-monitor uses laser fringeto obtain beam size • Effect of laser fringe phase fluctuationon the resolution of Shintake-monitor • Estimation by a Monte Carlo simulation • Status & test result (preliminary) of phase stabilization system • Summary
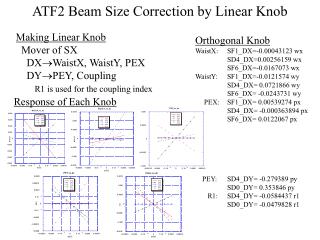
Accelerator Test Facility 2 (ATF2) • ATF2: a final focus test facility for ILC • ATF2 goals: • 35nm beam size (achieving, and maintaining for long time) • 2nm beam position stability on IP ATF2 ATF creates a verylow emittance e-beam, and ATF2(downstream ATF)focuses it. Dumping ring (ATF) 1.3 GeV Linac About 110 m
Shintake-monitor in FFTB & ATF2 • Shintake-monitor: a IP beam size monitor • Shintake-monitor in FFTB: (first experiment) • Proved the principle of measurement • Measured 70nm beam size • 1 hour to measure, resolution was not well estimated • Goals of Shintake-monitor in ATF2: • Used as a reliable beam size monitor • Measures 35nm beam size • 2nm resolution (and precise estimation of resolution) • 1 min. measuring time
Shintake-monitor Principle • Electron beam is scattered with laser photons at IP and emit gamma-rays. • If electron beam is well focused, number of gamma- rays is largely modulated by the phase of the fringe. • If not well focused, number of gamma is not so largely modulated. • Practically, we measure the modulation of gamma-ray signal obtained by gamma detector. • The “modulation depth” can easily be converted to beam size. • The left figure is FFTB result. It corresponds to 70nm beam size.
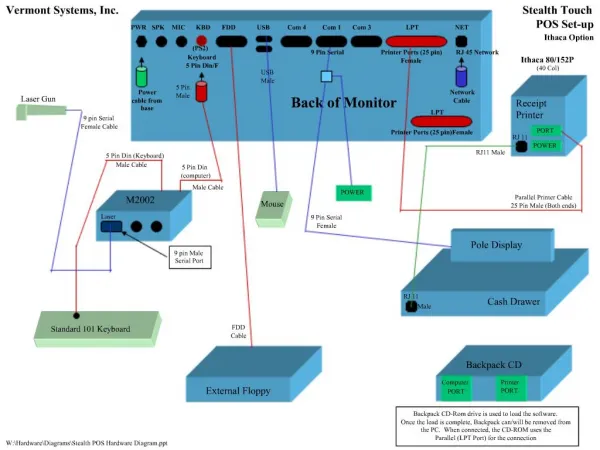
Shintake-monitor Table Layout Picture of Shintake-monitor Front optical table isfor laser optics tuning. We are using low power cw.test laser now. Laser beam is split and go across the IP from opposite direction. Size is 1.5m x 1.5m.
Effect of laser fringe phase fluctuation on the resolution of Shintake-monitor
Required Modulation Resolution GOAL : to measure 35 nm beam size by < 2nm resolution zoom 2nm beam size corresponds to 3% modulation (around 35nm). We need 3% modulation resolution. Then, how much stability of laser fringe phase do we need to achieve 3% modulation resolution? We performed a Monte Carlo simulation to obtain that relation.
Modulation Error Estimation Assumed measuring condition for simulation is: 45 points (phases) meas., 1 bunch for each point It’s determined by desired measuring time (1 minute) 45 points 1 bunch + same for background reduction = 90 bunches. 90 bunches / 1.5 Hz (ATF2 operation freq.) ~ 60sec. Simulation method is shown below (by example) A sample of error simulation caused by phase jitter
Required Fringe Stability The result of simulation: • modulation uncertainty is proportional to phase jitter. • About 30nm stability corresponds to 3%(goal) modulation uncertainty. • But we should consider another errors. We keep safe factor 3. As a result, We should develop a 10nm level fringe phase stabilization system.
Status & Test Result (Preliminary) of Phase Stabilization System
The Method of Phase Detection Fringe magnification by a lens with a linear image sensor • The laser beams pass through the microscope lens to be magnified, and create fringe pattern. (lens works like a double slit) • The phase of the fringe corresponds to relative phase of 2 laser beams. • The phase is not much sensitive to position fluctuation of the beams, the lens and the sensor. • The phase is sensitive to angle fluctuation of the lens, but it may be corrected by fringe pitch (need to be checked)
Location of Monitors and a Scanner • We cannot place the phase monitor on IP. We place it “off-axis” position. • To cancel out difference of the phase between IP and monitor position,we place the same monitor on the other side (ch2). • We place a phase scanner (delay line with piezo mover) on one side.
Setup Linear image sensor(photo by HPK website)256 pix, 25um pitch
Fringe Phase Scanning System • Optical delay line usedfor phase stabilizationand scan • Resolution of piezo stage is 1nm, corresponds to 2nmphase resolution. • The stage can be controlled by PC up to 300Hz (sufficient speedfor stabilization).
Linear Image Sensor Data Raw spectrum. Wave of dense pitch Fourier spectrum. Clear peak near 2.5. • We use Fourier transform to obtain phase (at central channel) for high resolution and noise reduction. • Clear peak can be seen near 2.5 on Fourier spectrum. • It corresponds to the wave seen on raw spectrum. • We use the Fourier phase (i.e. argument of complex Fourier) of the peak for the phase stabilization.
Preliminary Result(1) Simply measured phase for 50 sec. No stabilization. • FT peak period: the phase of the Fourier peak freq.Fixed period: the phase of fixed freq. (near the peak). • Ch1 and Ch2 are almost opposite because they face opposite directions (it’s expected behavior). • This shows correlation of phases at two monitors.
Preliminary Result(2) • Stabilization effect is clearly observed. • s = 0.076 (3.2nm) for ch1 fixed (stabilized channel) • s = 0.178 (7.5nm) for ch2 fixed (unstabilized channel, except long-time drift) • Almost achieved 10nm stability for very bad condition(no cover, lenses with rods). We can improve further.
Summary • We will measure 35nm ATF2 beam size byShintake-monitor. • The goal of resolution is 2nm,that is corresponding to 3% modulation accuracy. • We should achieve 10nm phase stabilityto obtain 3% modulation & safe factor 3. • Fringe phase stabilization system consisted of 2 microscope lenses and linear image sensors were developed and tested, we succeeded to stabilize < 10nm by that system. • The result is preliminary, we should study further.
ATF2 Shintake-monitor group • Students • Taikan SUEHARA (Univ. of Tokyo, D2) • Optics (main table, laser table) • Overall design,etc. • Hakutaro YODA (Univ. of Tokyo, M1) • Gamma detector • Staffs • Tatsuya KUME (KEK) • Optics support (fringe stabilization etc.) • Yosuke Honda (KEK) • Support (optics etc.) • T.Tauchi (KEK), T.Sanuki (Univ. of Tokyo) • Advisor (ATF2, overall)
Phase detection method Pinhole scan > 1mm fringe (6゜,30゜ setup) not single shot simple theory (good for cross check) direct method CCD with fringe magnify optics (using microscope lens) > 1mm fringe (6゜,30゜ setup) single shot (usable for online monitor) indirect method (need to check responsibility) Wire scan ~ 250nm fringe (all setup) not single shot tuning is difficult direct method
Resolution to be Achieved GOAL : to measure 35 nm beam by < 2nm resolution • We have to suppress errorswithin 3% modulation. • This requires: • laser fringe phase stabilization, • laser power stabilization / monitor, • stabilization of table position, • gamma detector with high-reso, & • etc. • We have already estimated the above influences on resolution. 532nm laser is more suitable (we’ve already replaced laserwith 532nm by adding SHG crystal) 2nm beam size → 3% modulation error.
Stabilize to what? • We have to know the point of origin of stabilization. • We want to stabilize fringe to beam position • We cannot stabilize directly to “beam position”. • How to obtain beam position? (2 possibilities) • IP BPM. The other purpose of ATF2 is to achieve 2nm stabilization of beam position. IP BPM is used to achieve that.→ We can use the BPM center as the point of origin. • Position of the Final Doublet can be translated to beam position→ Position of the Final Doublet can also be the point of origin. • We are creating a stabilization system for above 2 points of origin (may be selectable).
First possibility : with IPBPM • IPBPM will be able to measure 2 nm BP. Dr. Honda and Mr. Nakamura are developing the IPBPM. • We plan to attach IPBPM within Shintake-monitor. • If IPBPM has enough resolution, we can use that (BPM cavity) as the point of origin. beam Shintakefringephase monitoredby us monitors IPBPM cavity IP BPM prototype by Dr.Honda
Second possibility : with MonALiSA position monitor • MonALiSA (former StaFF) uses a laser interferometer to monitor position between some objects. • Position of Final Doublet is correlated to beam position (by the relation of lens and focus point). • We can define the point of origin freely in Shintake table (MonALiSA can monitor the point). Fringephase monitorby us beam Shintakeoriginpoint correlation monitor byMoNALISA MonALiSA people and their proposed monitor (Urner’s talk on ATF2 project meeting, May 2006) Final Doublet