Download
1 / 17
170 likes | 336 Views
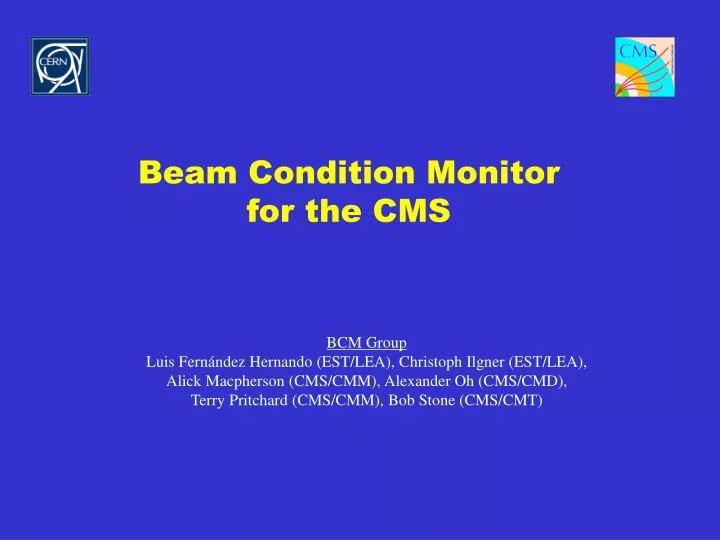
Beam Condition Monitor for the CMS. BCM Group Luis Fern á ndez Hernando (EST/LEA), Christoph Ilgner (EST/LEA), Alick Macpherson (CMS/CMM), Alexander Oh (CMS/CMD), Terry Pritchard (CMS/CMM), Bob Stone (CMS/CMT). Beam Condition Monitor for CMS. Purpose

E N D
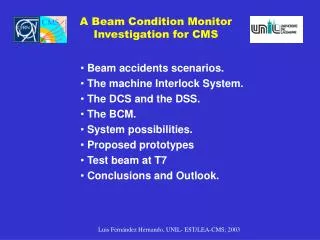
Beam Condition Monitor for the CMS BCM Group Luis Fernández Hernando (EST/LEA), Christoph Ilgner (EST/LEA), Alick Macpherson (CMS/CMM), Alexander Oh (CMS/CMD), Terry Pritchard (CMS/CMM), Bob Stone (CMS/CMT)
Beam Condition Monitor for CMS Purpose • The Beam Condition Monitor (BCM) has to provide online radiation monitoring within the CMS • BCM forms part of the radiation monitoring system for equipment safety and radiation level/beam monitoring • The BCM should be in addition to the LHC machine protection system and Beam Loss Monitors BCM Issues • Allows protection of equipment during instabilities/accidents • Provides fast feedback to the machine for optimization of beam conditions • Provides fast feedback to the machine for detection of adverse beam conditions • Monitors the instantaneous dose during operation • Provides input into LHC beam abort system (1 input/ experiment)
Accident Scenarios Unsynchronised beam abort: ~1012 protons lost in IP 5 in 260ns Beam condition monitors Looking for increase over normal rate Monitors to be within CMS and feed to machine interlock Sensors to be placed in the Pixel volume and after the Forward calorimeter z=±1.8m and r=4cm Evaluated using a fast extraction beam from the CERN PS at the T7 beamline (November 2003) • Sensors under investigation: Polycrystalline Diamond • Fast signal response • Radiation hardness • Minimal services required ie no cooling necessary
Beam AccidentsWhat are the timescales List of machine-identified equipment failures Fastest generic beam loss scenarios: ~ in 5 orbits ie ~ 500µs the beam is off by 3 sigma, this defines the response timescale of our system.
Beam AccidentsWhat are the timescales A MAD simulation for a D1 failure will serve us to calculate the numbers of protons that will be lost per turn. Then a Fluka simulation can give us the dose per turn that will allow us to set the timescales and the thresholds.
Conceptual BCM layout Cable Length ~11.5m Fast Amplifiers Placed outside CMS
DCS • Monitoring and control of the detector • DSS • Safeguard of experimental equipment • BCM • Input into DSS. • Protect subdetectors from adverse beam conditions • Redundant of the Beam Loss Monitors of the Machine BCM sensors
T7 Testbeam Hardware Diamond samples HV line Shielding box CDS126: 1x1cmx300 um thick Collection dist ~ 110 um CDS116: 1x1cmx500 um thick Collection dist ~ 125 um 3x1cmx500 um thick Collection dist ~ 40 um Signal cable= RG58 coax 3x 1010 protons/cm2 at centre Detector assembly Assembly in the beam shuttle Beam spot and dosimetry
November T7 Test beam: Fast extraction beam from the PS 4 width= 42ns Interbunch spacing= 262ns Beam intensity: 8x10¹¹protons per spill Fluence: ~3x10¹⁰ protons/cm2/spill at the centre of the beam spot ~1x10⁸ protons/cm2/spill in the halo
90 mm Film exposure of the beam after 40 bunches 6cm 0 1 3 2 = test point for placement of sensor Beam profile 55mm Beam Profile as measures by OSL film OSL =Optically Stimulated Luminesence • Relative fluence levels • Position 0 = 1.0 • Position 1 ~ 0.4 • Position 2 ~ 0.2 • Position 3 ~ 0.01
9cm Dosimetry measurements Beamspot Dosimetry Used 24Na for dosimetry on aluminum placed in the beam Dosimetry done by Maurice Glaser and Federico Ravotti Result Fluence at beam “centre” = 2.8x10¹⁰ protons/cm2 ± 10% Mapping of beam spot Consistency between the different films, the OSL, and the aluminum
Single shots • Single pulses from diamond • Bias on Diamond = +1 V/ µm • Readout of signal: • 16m of cable • no electronics • 20dB attenuation on signal cable (factor 10) Almost identical to PS beam profile
Single shots: Details Diamond Collection Distance Diamond signal ~ collection distance Collection distance (CDS116) ~125 µm Collection distance (CDS126) ~110 µm For std bias voltage of 1 V/µm • Area of pulse • Proportional to current from a bunch. • Use area to estimate bunch fluence. • Pulse area(CDS116@Pt 3) = 9.8x10⁷p/cm2 • Pulse area(CDS126@Pt 3) = 8.7x10⁷p/cm2 • Fair agreement with dosimetry results • Dosimetry(Al, @ Pt 3) = 2.2x10⁸p/cm2 • Diamond Collection Distance • Signals from sensors are large • V_max (CDS116) = 88 volts => 1.76 Amps into a 50 Ohm load • V_max (CDS126) = 61 volts => 1.22 Amps into a 50 Ohm load • Time response • Fit Gaussian to leading edge of pulses • (CDS126) =10.5 ± 0.5 ns Comparable to (PS)=10.5 ns with • (CDS116) = 9.0 ± 0.3 ns ~6% distortion from the signal cable • => No problem with extracting timing structure from sensors on 16 m coax cable
Diamond Multiple Bunches A 262ns C1 R1=R2 =1M SPICE Simulation of Voltage at Pt A • C1 acts as a reservoir capacitor • =>The larger the value the longer the bias field on the can be maintained. • C1(CDS126)=15 nF • C1 is sufficiently large to maintain bias across the diamond for the 8 bunches. C1R1 time constant ~15 ms • recharge of C1 is slow compared to bunch structure
Multiple Bunches CDS116 (125 µm @ 500V). The integration of the gaussian fit for the first peak gives a value of 1.2x10⁸p/cm2 CDS126 (110 µm @ 300V). The integration of the gaussian fit for the first peak gives a value of 9.05x10⁷p/cm2
Multiple Bunches CDS126 at 30 V bias. The amplitude of the signal for the first bunch is close to the bias voltage. Also shown is the bias field during the seven bunch shot. The diamond acts as a quasi conductor due to the high ionization density during each bunch and discharges the reservoir capacitance.
Conclusions CVD diamonds are able to withstand intense beams. They have been exposed to particle fluxes similar to an unsynchronized beam abort within the CMS experiment. Under such conditions the diamond samples are found to respond and recover from consecutive high intensity beam bunches. The observed high currents generated in the diamond from conditions similar to an unsynchronized beam abort require that a protection system for the BCM readout electronics be implemented.