Download
1 / 20
200 likes | 391 Views
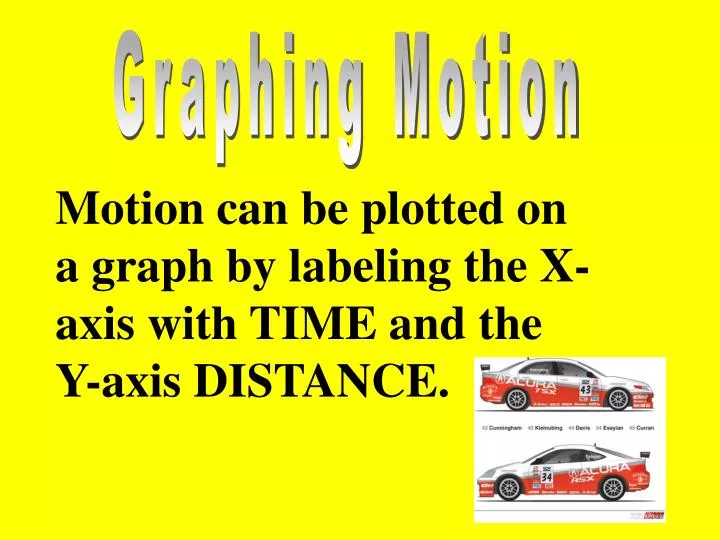
Graphing Motion. Motion can be plotted on a graph by labeling the X-axis with TIME and the Y-axis DISTANCE. A point on a graph can show the location and speed of an object at a particular time . . Those points are: x (time) y (distance). DON’T WRITE THIS.

E N D
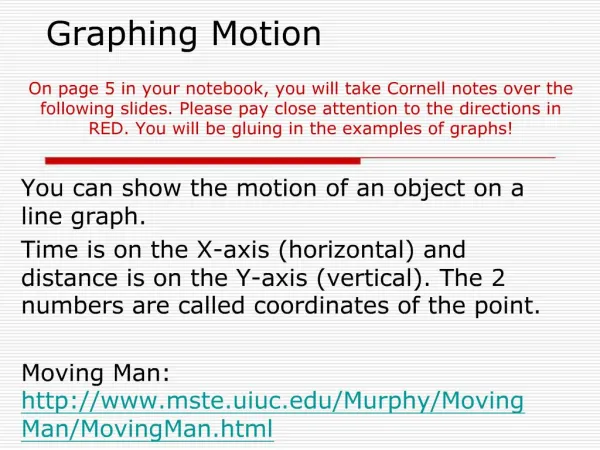
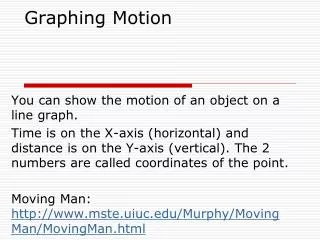
Graphing Motion Motion can be plotted on a graph by labeling the X-axis with TIME and the Y-axis DISTANCE.
A point on a graph can show the location and speed of an object at a particular time. Those points are: x (time) y (distance) DON’T WRITE THIS
Consider a car moving with a constant, rightward (+) velocity - say of +10 m/s. If the position-time data for such a car were graphed, the resulting graph would look like the graph at the right. Note that a motion described as a constant, positive velocity results in a line of constant and positive slope when plotted as a position-time graph. DON’T WRITE THIS www.glenbrook.k12
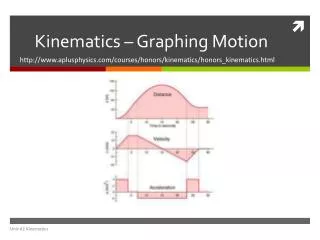
DON’T WRITE THIS Consider a car moving with a rightward (+), changing velocity - that is, a car that is moving rightward but speeding up or accelerating. If the position-time data for such a car were graphed, then the resulting graph would look like the graph at the right. Note that a motion described as a changing, positive velocity results in a line of changing and positive slope when plotted as a position-time graph. www.glenbrook.k12
Another example… activeart/motion_graphs/motion_graphs.html
Slope of a Line Slope tells you how one variable changes in relation to the other variable or the rate of change. DON’T WRITE THIS
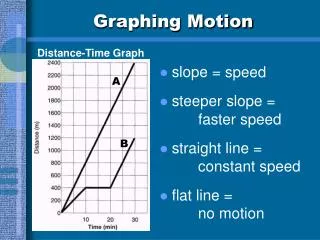
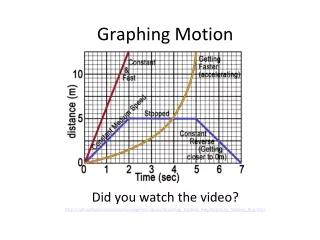
Speed and slope: Speed is the rate of change in distance in relation to time. The faster the object the steeper the slope.
This object is increasing speed. As time goes by, distance increases.
A straight line on a graph is linear or has constant speed. A non-linear line illustrates increasing or decreasing speed
Calculating Slope Rise Divided by Run y (distance) Rise Slope = x (time) Run OR…
y y - 2 1 SLOPE = x x - 2 1
Try to calculate the slope of the linear line. . 50 Rise is 20-50 meters . 20 Run is 4-10 seconds 4 10
What is the slope of the line from 2-3 seconds? • 15m/s • 10m/s • 3m/s
What is the slope of the line from 4-5 seconds? • 15m/s • 10m/s • 18m/s
What is the slope of the line from 4-5 seconds? Distance (meters) • 15m/s • 10m/s • 18m/s Time (seconds)
What is the slope of the line from 2-3 seconds? Distance (meters) • 15m/s • 10m/s • 18m/s Time (seconds)
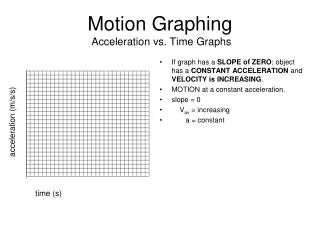
Importance of Slope and Motion • The shapes of the distance vs. time graphs for constant velocity and accelerated motion (i.e., changing velocity) - reveal an important principle. The principle is that the slope of the line shows useful information about the velocity of an object. Whatever characteristics the velocity has, the slope will exhibit the same. If the velocity is constant, then the slope is constant (i.e., a straight line). If the velocity is changing, then the slope is changing (i.e., a curved line). If the velocity is positive, then the slope is positive (i.e., moving upwards and to the right). This can be applied to any motion. www.glenbrook.k12