Download
1 / 1
10 likes | 123 Views
Phase transition in the H 2 O-H 2 system at pressures up to 10 kbar V. Efimchenko (1), M. Kuzovnikov (1) and M. Tkacz (2) (1) Institute of Solid State Physics, Chernogolovka, Russia, (2) Institute of Physical Chemistry ,Warsaw, Poland (efimchen@issp.ac.ru. / Fax: +7 - 496 - 522 8160).

E N D
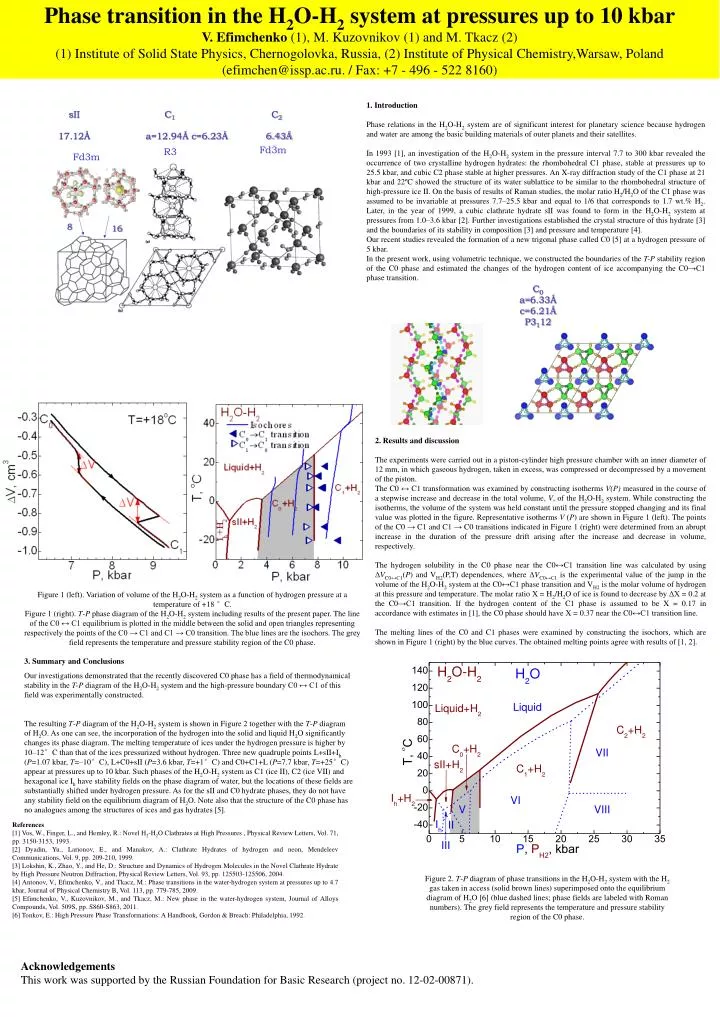
Phase transition in the H2O-H2 system at pressures up to 10 kbar V. Efimchenko (1), M. Kuzovnikov (1) and M. Tkacz (2) (1) Institute of Solid State Physics, Chernogolovka, Russia, (2) Institute of Physical Chemistry,Warsaw, Poland (efimchen@issp.ac.ru. / Fax: +7 - 496 - 522 8160) sII C1 C2 17.12Å a=12.94Å c=6.23Å 6.43Å 8 16 1. Introduction Phase relations in the H2O-H2 system are of significant interest for planetary science because hydrogen and water are among the basic building materials of outer planets and their satellites. In 1993 [1], an investigation of the H2O-H2 system in the pressure interval 7.7 to 300 kbar revealed the occurrence of two crystalline hydrogen hydrates: the rhombohedral C1 phase, stable at pressures up to 25.5 kbar, and cubic C2 phase stable at higher pressures. An X-ray diffraction study of the C1 phase at 21 kbar and 22ºC showed the structure of its water sublattice to be similar to the rhombohedral structure of high-pressure ice II. On the basis of results of Raman studies, the molar ratio H2/H2O of the C1 phase was assumed to be invariable at pressures 7.7–25.5 kbar and equal to 1/6 that corresponds to 1.7 wt.% H2. Later, in the year of 1999, a cubic clathrate hydrate sII was found to form in the H2O-H2 system at pressures from 1.0–3.6 kbar [2]. Further investigations established the crystal structure of this hydrate [3] and the boundaries of its stability in composition [3] and pressure and temperature [4]. Our recent studies revealed the formation of a new trigonal phase called С0 [5] at a hydrogen pressure of 5 kbar. In the present work, using volumetric technique, we constructed the boundaries of the T-Pstability region of the C0 phase and estimated the changes of the hydrogen content of ice accompanying the C0→C1 phase transition. C0 a=6.33Å c=6.21Å P3112 2. Results and discussion The experiments were carried out in a piston-cylinder high pressure chamber with an inner diameter of 12 mm, in which gaseous hydrogen, taken in excess, was compressed or decompressed by a movement of the piston. The C0 ↔ C1 transformation was examined by constructing isotherms V(P) measured in the course of a stepwise increase and decrease in the total volume, V, of the H2O-H2 system. While constructing the isotherms, the volume of the system was held constant until the pressure stopped changing and its final value was plotted in the figure. Representative isotherms V (P) are shown in Figure 1 (left). The points of the C0 → C1 and C1 → C0 transitions indicated in Figure 1 (right) were determined from an abrupt increase in the duration of the pressure drift arising after the increase and decrease in volume, respectively. The hydrogen solubility in the C0 phase near the C0↔C1 transition line was calculated by using ΔVC0↔C1(P) and VH2(P,T) dependences, where ΔVC0↔C1 is the experimental value of the jump in the volume of the H2O-H2 system at the C0↔C1 phase transition and VH2 is the molar volume of hydrogen at this pressure and temperature. The molar ratio X = H2/H2O of ice is found to decrease by ΔX = 0.2 at the C0→C1 transition. If the hydrogen content of the C1 phase is assumed to be X = 0.17 in accordance with estimates in [1], the C0 phase should have X = 0.37 near the C0↔C1 transition line. The melting lines of the C0 and C1 phases were examined by constructing the isochors, which are shown in Figure 1 (right) by the blue curves. The obtained melting points agree with results of [1, 2]. Figure 1 (left). Variation of volume of the H2O-H2 system as a function of hydrogen pressure at a temperature of +18 °C. Figure 1 (right). T-P phase diagram of the H2O-H2 system including results of the present paper. The line of the C0 ↔ C1 equilibrium is plotted in the middle between the solid and open triangles representing respectively the points of the C0 → C1 and C1 → C0 transition. The blue lines are the isochors. The grey field represents the temperature and pressure stability region of the C0 phase. 3. Summary and Conclusions Our investigations demonstrated that the recently discovered C0 phase has a field of thermodynamical stability in the T-P diagram of the H2O-H2 system and the high-pressure boundary C0 ↔ C1 of this field was experimentally constructed. The resulting T-P diagram of the H2O-H2 system is shown in Figure 2 together with the T-P diagram of H2O. As one can see, the incorporation of the hydrogen into the solid and liquid H2O significantly changes its phase diagram. The melting temperature of ices under the hydrogen pressure is higher by 10–12°C than that of the ices pressurized without hydrogen. Three new quadruple points L+sII+Ih (P=1.07 kbar, T=–10°C), L+C0+sII (P=3.6 kbar, T=+1°C) and C0+C1+L (P=7.7 kbar, T=+25°C) appear at pressures up to 10 kbar. Such phases of the H2O-H2 system as C1 (ice II), C2 (ice VII) and hexagonal ice Ih have stability fields on the phase diagram of water, but the locations of these fields are substantially shifted under hydrogen pressure. As for the sII and C0 hydrate phases, they do not have any stability field on the equilibrium diagram of H2O. Note also that the structure of the C0 phase has no analogues among the structures of ices and gas hydrates [5]. References [1] Vos, W., Finger, L., and Hemley, R.: Novel H2-H2O Clathrates at High Pressures , Physical Review Letters, Vol. 71, pp. 3150-3153, 1993. [2] Dyadin, Yu., Larionov, E., and Manakov, A.: Clathrate Hydrates of hydrogen and neon, Mendeleev Communications, Vol. 9, pp. 209-210, 1999. [3] Lokshin, K., Zhao, Y., and He, D.: Structure and Dynamics of Hydrogen Molecules in the Novel Clathrate Hydrate by High Pressure Neutron Diffraction, Physical Review Letters, Vol. 93, pp. 125503-125506, 2004. [4] Antonov, V., Efimchenko, V., and Tkacz, M.: Phase transitions in the water-hydrogen system at pressures up to 4.7 kbar, Journal of Physical Chemistry B, Vol. 113, pp. 779-785, 2009. [5] Efimchenko, V., Kuzovnikov, M., and Tkacz, M.: New phase in the water-hydrogen system, Journal of Alloys Compounds, Vol. 509S, pp. S860-S863, 2011. [6] Tonkov, E.: High Pressure Phase Transformations: A Handbook, Gordon & Breach: Philadelphia, 1992. Figure 2. T-P diagram of phase transitions in the H2O-H2 system with the H2 gas taken in access (solid brown lines) superimposed onto the equilibrium diagram of H2O [6] (blue dashed lines; phase fields are labeled with Roman numbers). The grey field represents the temperature and pressure stability region of the C0 phase. Acknowledgements This work was supported by the Russian Foundation for Basic Research (project no. 12-02-00871).


![[SO 2 + H 2 O H 2 SO 3 ] SO 3 + H 2 O H 2 SO 4 CO 2 +H 2 O H 2 CO 3](https://cdn2.slideserve.com/4275035/slide1-dt.jpg)
![K a = [ H + ] [ C 2 H 3 O 2 - ] [ HC 2 H 3 O 2 ]](https://cdn2.slideserve.com/5089471/slide1-dt.jpg)