Download
1 / 32
330 likes | 477 Views
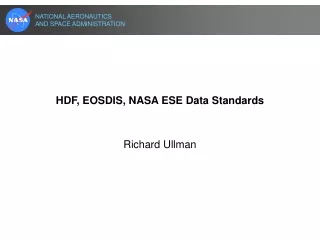
NASA EOSDIS Data Centers, Some Cool Tools and Resources. Presented by: Jennifer Brennan, NASA EOSDIS Outreach Lead Wednesday, May 19, 2010. Data Centers and their disciplines. ASF SDC-Alaska Satellite Facility Synthetic Aperture Radar (SAR) Data Center Fairbanks, Alaska

E N D
NASA EOSDIS Data Centers, Some Cool Tools and Resources Presented by: Jennifer Brennan, NASA EOSDIS Outreach Lead Wednesday, May 19, 2010
Data Centers and their disciplines ASF SDC-Alaska Satellite Facility Synthetic Aperture Radar (SAR) Data Center Fairbanks, Alaska Synthetic Aperture Radar (SAR) products, Sea Ice, Polar Processes and Geophysics CDDIS- Crustal Dynamics Data Information System Greenbelt, MD Space Geodesy GES DISC - GSFC Earth Sciences Data and Information Services Center Greenbelt, MD Global Precipitation, Solar Irradiance, Atmospheric Composition, Atmospheric Dynamics and Global Modeling GHRC DAAC- Global Hydrology Resource Center Distributed Active Archive Center (DAAC) Huntsville, AL Hydrologic Cycle, Severe Weather Interactions, Lightning, Atmospheric Convection
LP DAAC- Land Processes DAAC Sioux Falls, SD Surface Reflectance, Land Cover, Vegetation Indices MODAPS LAADS- MODAPS Level-1 Atmospheres Archive and Distribution System –Greenbelt, MD MODIS Level-1 and Atmosphere Data Products LaRC ASDC - Langley Research Center Atmospheric Science Data Center Hampton, VA Radiation Budget, Clouds, Aerosols, Tropospheric Chemistry NSIDC DAAC- National Snow and Ice Data Center DAAC Boulder, CO Snow and Ice, Cryosphere, Climate Interactions, Sea Ice Data Centers and their disciplines
Data Centers and their disciplines ORNL DAAC- Oak Ridge National Laboratory DAAC Oak Ridge, TN Biogeochemical Dynamics, Ecological Data, Environmental Processes Ocean Biology Processing Group Greenbelt, MD Ocean Biology, Sea Surface Temperature, Biogeochemistry PO.DAAC-Physical Oceanography DAAC Pasadena, CA Sea Surface Temperature, Ocean Winds, Circulation and Currents SEDAC- Socioeconomic Data and Applications Data Center Palisades, NY Human Interactions, Land Use, Environmental Sustainability, Geospatial Data, Multilateral Environmental Agreements
Some Cool Tools and Data Center Resources*Note: Ask me for a short demo during lunch Thursday* Giovanni- Goddard Earth Science Data and Information Services Center (GES DISC) New Facebook link on NASA’s Facebook page http://disc.sci.gsfc.nasa.gov/giovanni Arctic Sea-Ice Blog (National Snow and Ice Data Center DAAC) http://nsidc.org/arcticseaicenews/ Population Estimation Service (Socioeconomic Data and Application Center) Key feature: draw a polygon around your region of interest and it will calculate the land area and number of people within that polygon. http://sedac.ciein.coumbia.edu/gpw/wps.jsp Spatial Data Analysis Tool (SDAT)- Oak Ridge National Laboratory DAAC and MODIS Global Subsetting Tool (for select land products) http://webmap.ornl.gov/wcsdown
What is Giovanni? Giovanni is a Web-based data exploration system that enables rapid data access, analysis, and visualization online – users do not have to download data files to their own system before initiating analysis and research Giovanni stands for • GES DISC • Interactive • Online • Visualization • ANd • aNalysis • Infrastructure
Features of Giovanni- in a nutshell The main components of the Giovanni system are: • an interactive map for region-of-interest selection • a menu of available data products • a calendar menu for time-period selection • a menu of visualization options • visualization-specific options (color palette, axis values) • menu of output options
Hövmoller plots – ideal for visualization of seasonal signals Giovanni output types Area plot (lat-lon map) San Francisco Bay and Monterey Bay Gulf of Panama El Niño effect Time -series Giovanni provides output as ASCII, HDF, and KMZ (Google) Earth) files
Giovanni output types: Visualization-specific options Y-axis customization Pre-defined color palette Customized color palette Facilitates plot comparisons Increased detail
Aerosol Products:PM2.5, MODIS and OMI Views of California FiresOctober 2007 OMI UV Aerosol Index Level-3 MODIS AOD EPA AIRNow PM2.5(ug/m3) Oct. 24th Oct. 25th
Spatial Data Access Tool (SDAT) • Web-based tool that enables users to browse, visualize, and download geospatial data in various user selected spatial/temporal extents, formats, and projections • Data include selected ORNL DAAC Archived Data Sets as well as other biogeochemical dynamics related data (Land Cover, Elevation, Climate and Ecoregion Classifications, and Soils).
About SDAT • Provides access to various geospatial data through Open Geospatial Consortium (OGC) standards-based Web Services • Web Map Service v1.1.1 • Web Coverage Service v1.0.0 • Two levels of tool features • Data Set Level • Data File (granule) Level Demo
About SDAT • Provides access to various geospatial data through Open Geospatial Consortium (OGC) standards-based Web Services • Web Map Service v1.1.1 • Web Coverage Service v1.0.0 • Two levels of tool features • Data Set Level • Data File (granule) Level Demo
Spatial Data Access Tool (SDAT) • Data Set Level • Google Earth Visualization • Metadata • Proceed to Data File/Granule Level • Data File/Granule Level • Metadata • Projection • Resolution • Format • Time • Bands • Interpolation Method • Spatial Extent • Download Demo
Spatial Data Access Tool (SDAT) • Data Set Level • Google Earth Visualization • Metadata • Proceed to Data File/Granule Level • Data File/Granule Level • Metadata • Projection • Resolution • Format • Time • Bands • Interpolation Method • Spatial Extent • Download Demo
Spatial Data Access Tool (SDAT) • Data Set Level • Google Earth Visualization • Metadata • Proceed to Data File/Granule Level • Data File/Granule Level • Metadata • Projection • Resolution • Format • Time • Bands • Interpolation Method • Spatial Extent • Download Demo
SDAT - MODIS Land Cover (500 m)(IGBP Classification) KML File generated using Karl Benedict’s WMS to KMZ Conversion Tool
Center Pixel Mean Value of Pixels Percent of Pixels that meet QC Criteria MODIS Land Product Site Analysis Tools (MLP SAT) • In a scale and format (text, GeoTIFF) useful for field researchers Three methods to obtain subsets • Tool for 1,147 selected sites • Tool for any user selected location on demand • User selects product, time period, location, and area (1 x 1 km up to 200 x 200 km) worldwide and for user-selected time periods • WebService • Programmatically obtain MODIS subsets for any land location, time period and area (from 1 pixel up to 201 x 201 km) using a standards based SOAP Web Service EVI (Enhanced Veg. Index) in Southern CA December 2003 fire 1,147 field sites for MODIS Collection 5
MODIS Global Tool, Step 1 - select Location • http://daac.ornl.gov/cgi-bin/MODIS/GLBVIZ_1_Glb/modis_subset_order_global_col5.pl
MODIS Global Tool, Step 2 - select data layer and subset size (LST and 100 X 100)
MODIS Global Tool, Step 3 - select temporal range, provide email address, and submit
MODIS Global Tool, Step 4 – order description and subset creation
MODIS Global Tool, Step 6 – order notification and data retrieval • Link to visualization and data • Citation
MODIS Global Tool, Data Files can be downloaded • Each order page has links to the data files (on http server) • Help files explain contents and format
Resulting Data • Unique URL for each order: • http://daac.ornl.gov/glb_viz_2/31Mar2010_11:35:19_188200623L34.25L-118S801L801_MOD13Q1/index.html
Conclusions Many available tools for visualization and analysis of NASA Satellite data products Data centers provide wealth of information regarding not only data products, but also data tools, educational products and tutorials. Retrospective analysis (e.g. Giovanni,) -Image access and analysis tools, include ground based, model, and meteorological data Google Earth visualization is possible for many NASA satellite data products 31
For more information • For more information about the NASA EOSDIS data centers, data products and data services see, http://nasadaacs.eos.nasa.gov • For NASA EOSDIS Outreach Resources see, http://eos.nasa.gov/outreach • Questions? Contact: Jennifer Brennan, NASA EOSDIS Outreach Lead E-mail: Jennifer.L.Brennan@nasa.gov Telephone: 301-352-4628