Download
1 / 54
540 likes | 633 Views
COMPARISON OF FTIR SPECTRA OF BIOMOLECULES ACQUIRED USING SYNCHROTRON IR AND THERMAL IR SOURCES. Sevim Akyüz Physics Department, Istanbul Kültür University, Ataköy Campus, Bakirköy, 34156, Istanbul, Turkey.

E N D
COMPARISON OF FTIR SPECTRA OF BIOMOLECULES ACQUIRED USING SYNCHROTRON IR AND THERMAL IR SOURCES Sevim Akyüz Physics Department, Istanbul Kültür University, Ataköy Campus, Bakirköy, 34156, Istanbul, Turkey
FTIR spectroscopy is a powerful tool for qualitative and quantitative analysis of molecular structures. It has the ability to characterize different samples (for instance, organic and inorganic materials, or crystalline and amorphous materials) in the same time. Any alterations in the molecular composition or molecular orientation can be detected. On the other hand IR micro-spectrometry is preferable for analyzing inhomogeneous structures.For investigation of biological molecules or cultural heritage metarials, that have inhomogeneus structures, generally IR micro-spectroscopy is used which has ability to monitor the chemical composition point by point, using the inherent spectral properties of the components. But the spatial resolution for conventional IR micro-spectrometry measurements is limited.
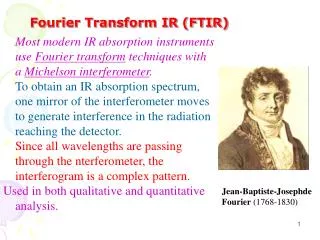
Synchrotron radiation based Fourier-transform infrared (S-FTIR) micro-spectroscopy is a new-developed technique, which combines the advantages of FTIR spectroscopy and synchrotron light source. Synchrotron light source is used as external IR source. Conventional IR spectrometers have thermal sources (Globar or Nents Glower), they produce radiant energy based on black body radiation. They produce IR spectrum from a filament heated to 1000 to 2000 K. These seramic sources are physically large (at least several millimeters), and typically radiate in all directions. The optics of the FTIR bench collects and collimates the IR radiation, passes it through the interferometer, and then on to the IR microscope where the modulated IR light is focused to a small spot on a sample. Finally, the IR radiation, reflected or transmitted from the sample is collected, focused onto an appropriate infrared detector, and processed by a computer via a Fourier transform to produce an infrared spectrum.
The thermal emission sources can be focused to 75–100 μm diameter with an IR microscope.In order to measure something smaller, we must mask away part of the incoming light, significantly reducing the signal strength. The spatial resolution for IR-MSP measurements is limited in practice by two factors. The first factoris the size of the aperture used to limit the size of the image that is projected through the IR microscope onto the detector. In order to resolve individual cells, or components thereof, apertures as small as 10 m are desirable. However, the low intensity of light passing such a small aperture seriously restricts the ability to collect an absorption spectrum at such high spatial resolution.
The second factoris a diffraction effect that becomes significant when the size of the aperture approaches the wavelength of light utilized. A true point source could be focused to a diffraction-limited spot size, which is approximately the wavelength of the light. This can be achieved with a synchrotron IR. For mid-IR and longer wavelengths, the effective source size for a synchrotron light source is diffraction-limited spot size. In other words, it is very close to an ideal point source. The beam is focused to a spot with a diameter ≤10 μm, which is smaller than a typical mammalian cell, and provides thousand times the brightness of conventional IR sources.
Synchrotron as an IR source makes a big improvement.Synchrotron radiation is a high-brightness infrared source, which is well suited to spectroscopy. The spectral range,which extends from about 2.5 to 20 micron, so-called mid-infrared region, spans most of the vibrational mode frequencies necessary to a detailed identification of functional chemical groups. The primary advantage of synchrotron infrared radiation is its brightness. The brightness of synchrotron light is defined as the photon flux or power emitted per source area and solid angle. It is important to note that synchrotron radiation does not provide a much higher photon flux than a conventional IR source (such as a globar). The crucial factor is that the effective synchrotron source size is quite small, i.e. on the order of 100 m or less. Thus, the light is emitted into a narrow range of angles, and the resulting brightness is vastly increased.
Synchrotron Source Advantages Higher spatial resolution Brightness (1000 x) Better signal-to-noise ratio Faster collection + Spectroscopy Broadband Heating at sample is negligable Lateral resolution is limited by diffraction; in confocal configuration it is l/2
The ultra-brightness and high spatial resolution of synchrotron light source ensure S-FTIR micro-spectroscopy is capable of analyzing small samples or small sample areas that conventional FTIR cannot do. Due to high brightness, infrared light from a synchrotron can be easily collimated and/or focused to diffraction limited spot sizes (~1-10 μm), allowing high spatial resolution and high spectral resolution.
IR spectra of single red blood cell; recorded with synchrotron IR (red) and with conventional IR spectrometers1. 1- D. McNaughton, Australian Biochemist,36(1), (2005) 55-58
IR spectra obtained on the same individual cell(HELA cell), using either the synchrotron beam (a), or thermal source (globar), with an aperture of 6x 6 (µm)2. Taken from: P. Dumas, L.M. Millerand M.J. Tobin, Acta Physica Polonica A, 115 (2009) 446-454
Synchrotron-based FTIR spectrum in plant seed endosperm tissue (wheat) (pixel size: 10mm×10mm). Taken from ref 2. Ca. 1720-1500 cm-1 = protein (amide I and amide II bands) ca. 1185–800 cm−1 = total carbohydrate ca.1065–950cm−1 = non-structuralcarbohydrate (starch) region 2- P. Yu, H.C. Block, K. Doiron, Spectrochimica Acta Part A 71 (2009) 1837–1844
INTERACTION OF 24-EPIBRASSINOLIDE WITH CULTURED PROSTATE CANCER CELLS (DU145, PC3) AND EPITHELIAL CELLS (PNT1A): AN FT-IR SPECTROSCOPIC STUDY Sevim Akyuz1, Tanil Akyuz1, Pinar Obakan2, E. Damla Arisan2, Narcin Palavan-Unsal2 1Istanbul Kultur University, Department of Physics, Atakoy Campus, 34156 Bakirkoy, Istanbul, Turkey, e-mail: s.akyuz@iku.edu.tr 2Department of Molecular Biology and Genetics, Atakoy Campus, 34156 Bakirkoy, Istanbul, Turkey
Brassinosteroids (BRs), belong a class of polyhydroxysteroids, are growth-promoting plant steroids that possess various types of regulator activity in plants. In addition to stimulating growth, BRs have an anti-stress effect on plants. They have the ability to overcome both abiotic and biotic stress in plants [3].Recently it was shown that natural brassinosteroids can inhibit the growth of various cancer cell lines at micromolar concentrations, despite having minimal effects on normal cells. Therefore brassinosteroids are promising leads for potential anticancer drugs. 24-Epibrassinolide (C28H48O6) is a brassinosteroid [4]. [3] C. Brosa, Crit. Rev. Biochem. Mol. Biol., 34 (1999), 339–358. [4] J. Steigerova, J. Oklestkova, M. Levkova, L. Rarova,Z. Kolar, M. Strnad, Chem-Biol Interact 188 (2010), 487–496.
In this study the interaction of cultured prostate cancer cells (DU145 and PC3) with 24-epibrassinolide, a promising drug candidate in cancer therapy, have been investigated using Fourier transform infrared spectroscopy (FTIR) in order to investigate the alterations of intracellular composition and conformation, induced by epibrassinolide. We also investigated the effects of epibrassinolide on prostate epithelial cells (PNT1A). 24-epibrassinolide C28H48O6
An infrared spectrum of a biological sample is composed of characteristic absorption bands originating from all molecules it contains, such as proteins, lipids, nucleic acids, and others. FTIR spectroscopy, one of the few spectroscopic techniques that can detect changes in many different biomolecules simultaneously and in situ, has proven to be a useful tool for the detection of molecular changes directly in the cells, tissues. In this study we carefully investigated protein structure by analysing amide I, amide II and amide III bands, DNA structure by analysing phosphodiester group of PO2- stretching bands around 1250-1080 cm-1 and DNA bands of the backbone chain around 830-880 cm-1 regions
Amide I mode Protein conformation
Amide I mode is primary a C=O stretching motion of amide groups, couples slightly with C-N stretching, N-H bending and CCN deformation motions [5,6]. Amide II mode is N-H in plane bending motion coupled with C-N stretching [5]. The Amide III mode is mainly in-phase combination of NH in-plane bending and CN stretching motions. It has minor contributions fromCC stretching and CO bending [5] Due to the overlapping of protein amide component peaks, second derivative profiles of the absorption spectrum was used to identfy amide I, amide II and amide III component peaks, then multicomponent peaks fitting with Gaussian function was used to quantify the multicomponent peak area in amide regions. [5] W.K. Surewicz, H.H. Mantsch, “Infrared Absorption Methods for Examining Protein Structure” in “Spectroscopic Methods for Determining Protein Structure in Solution”, (Ed. H.A. Havel),VCA pub. Inc, 1996, NY. [6] A. Barth, Biochim. Biopys. Acta 1767 (2007) 1073.
Amide I and amide II regions of protein structure Cultured prostate cancer cells Water bands are subtracted Cancer cells containing 25 mM epibrassinolide, a promising drug candidate in cancer therapy
Amide I and amide II regions of protein structure Comparison of the second derivative profiles of the IR absorption spectra of DU145 prostate cell line containing 0 and 25 mM Epibrassinolide, after subtracting water bands.
In addition to alterations in proteins conformation, significant spectral changes were also observed at the intensities of characteristic DNA/RNA bands of prostate cancer cells. Particularly asymmetric phosphate (PO2-) stretching mode of phosphodiester backbone of nucleic acids is affected by the presence of epibrassinolide. It was found that the hydrogen bonding of the phosphodiester groups of nucleic acids decreases with the presence of epibrassinolide, which indicates alterations in DNA packing condition.
- PO 2 a C 1485-1010 cm-1 region of the IR spectra of prostate cancer cell line DU145, with and without epibrassinolide ca.1401 cm-1cytidine; ca.1239 cm-1PO2- asimetric stretching; ca1087 cm-1PO2- symmetric stretching vibrations.
Band component analysis of the 1340-1020 cm-1 region of the IR spectrum of prostate cancer cell line DU145 The 1222 cm-1 and 1244 cm-1 bands of LNCaP cell lines are assigned to strongly hydrogen bonded and weakly-hydrogen bonded phosphodiester groups of nucleic acids. The integrated intensity ratio of these bands for LNCaP ((I1222 / I1244) is found to decrease by the addition of EBR,
DU145 +EBR Band component analysis of the 12800-1020 cm-1 region of the IR spectrum of prostate cancer cell line DU145 containing 25mM epibrassinolide
When we compared the band components of the PO2- asymmetric stretching mode of the phosphodiester group of DNA we sow hydrogen bonding of the phosphodiester groups of nucleic acids decreases with the presence of EBR, which indicates alterations in DNA packing condition
PC3 is another prostate cancer cell line In a previous study, It was also shown that in B to A transition B-DNA marker band 1228 (*) shifts to 1240 (**) {D.K. Jangir, G. Tyagi, R. Mehrotra, S. Kundu, J. Mol Struct 869 (2010) 126-129}
Epithelial cells {Not-cancereous; normal cell line} Band component analysis of the FTIR spectrum of the 1485-1010 cm-1 region of epithelial cells (PNT1A)
We did not see the same significant alteration in phosphodoester bands of DNA by the presence of EBR in epithelial cells (PNT1A)
EPITHELIAL CELLS (PNT1A): We did not see the same significant alteration in epithelial cells (PNT1A) by the presence of epibrassinolide
1000-700 cm-1 region of prostate cancer cell line DU145 B-DNA A-DNA 836 cm-1 is a marker band of B-DNA;869 is a marker band of A-DNA. Presence of epibrassinolide causes partial BA transition of DNA in DU 145 cell line. .
In order to reveal the data embedded in the molecular structure of prostate cancer cells containing 25mM epibrassinolide in comparison with those of the control group, we performed a chemometric method, principle component analysis (PCA). Principle component analysis was performed on IR spectra of control group and EBR containing prostate cancer cells, after subtracting water bands using The Unscrambler CAMO software. PCA is a multivariate analysis technique that reduces data matrix to their lowest orthogonal space, and found to be very informative to obtain hidden data structures [8]. Mathematically, PCA is based on an eigenvector decomposition of the covariance matrix of the variables in a data set. Given a data matrix X with m rows of samples and ncolumns of variables, the covariance matrix of X is defined as: {Cov}(X) = (XTX) / m-1 Here XT is transpose matrix of data matrix X and m is the number of samples. The result of the PCA procedure is a decomposition of the data matrix X into principal components called score and loading vectors. As matrix notation we can write data matrix X: X = T PT +E Here T is the score matrix, PT is the transpose of P loading matrix and E is the residual matrix. The score matrix (T) is related to the sample contributions, and the loadings matrix (P) is related to the variables contributions.
The score and loading matrixes contain information on how the samples and variables, respectively, relate to each other. In the present study, X matrix contains IR spectra of control group (DU145 prostate cell line) and 25 mM Epibrassinolide containing DU145 cell line (after subtracted water bands). Every sample spectrum is an average of 5 replicate spectra, 6 control, and 7 epibrassinolide containing samples were analyzed. The components PC1 and PC2 (Figure) show all contribution to the variance in concentrations (PC1 = 95 %, PC2 = 5%), which are enough to separate the samples.
In order to reveal the similarities and dissimilarities between control group prostate cancer cell and epibrassionilide containing cells, Hierarchical Average linkage cluster analysis were performed on the 1800-600 cm-1 region of the vector normalized IR spectra (water bands were subtracted) using Euclidean distance. The dendrongram is as follows:
CONCLUSIONS • IR spectroscopy has proven to be a a powerfull tool for the detection of molecular changes in the cells. • Significant spectral changes were observed at the intensities and frequencies of characteristic protein and DNA vibrational bands of prostate cell lines. Hydrogen bonding of the phosphodiester groups of nucleic acids and phospholipids decreases with the presence of EBR, which indicates alterations in DNA packing condition. Presence of epibrassinolide causes partial BA transition of DNA • We also observed alterations in amide I and II bands which may indicate alterations of the secondary structure of cell proteins by the presence of epibrassinolide. • However no significant effect of epibrassinolide on cultured prostate epithelial cells was observed. • Multivariate statistical analyses clearly indicated the differences between epibrassinolide containing prostate cell lines and their control groups.
FTIR AND EDXRF INVESTIGATIONS OF THE SECOND GENERATIONS OF SALT TOLERANT SOYBEAN MUTANTS Sevim Akyuz*, Tanil Akyuz*, Ozge Celik**, andCimen Atak** *Physics Department, Science and Letters Faculty, Istanbul Kultur University, Atakoy Campus, Bakirkoy 34156, Istanbul, Turkey. **Molecular Biology and Genetics Department, Science and Letters Faculty, Istanbul Kultur University, Atakoy Campus, Bakirkoy 34156, Istanbul, Turkey.
In this study the elemental and molecular structural alterations of the gamma induced mutants of salt tolerant soybean seeds were investigated in comparison with those of control groups. The protein, lipid and carbohydrate structure of the second (M2) generations of the salt tolerant soybean seeds and control group were investigated by FTIR spectrometry. The seeds of S04-05 (Ustun 1)) variety divided into two groups. Firstly, a group of the seeds were gamma irradiated with 150 Gy dose, using Cs-137 gamma source in IBL 437C irradiation property at dose rate of 6.248 Gy/min while the other group of the seeds (control group) were unirradiated. The irradiation doses have been selected according to cause minimum physiological damages. Salt tolerance studies were performed in M2 generation of -irradiated seeds of S04-05 (Ustun 1) variety in vitro conditions.
FT-IR spectra of soybean seads; C = control group; M = Mutants Lipid (3000-2800, ca.1700 cm-1); protein (1690-1530; 1300-1200 cm-1), cellulosic compounds (ca.1450-1100 cm-1) and carbohydrate (ca.1200-900 cm-1) bands are observed From the original spectra of soybean seeds, it is impossible to find any differences between the control group and mutants of salt tolerant soybean seeds
Band component analysis of CH stretching region of the IR spectrum of a control group soybean seed. Gaussian function was used to quantify the multicomponent peak area. 3009 cm-1 band is characteristics CH stretching mode of starch
Soybean seed protein contains a mix structures , including α-helices, β-sheets and β-turns.
When the ratios of α-helices and β-sheets differ in the protein structure, protein nutritive value may also differ [4].Since proteins specific susceptibility to inhibitory activities in the gastrointestinal tract is highly associated with its secondary structure
Second derivatives of the FTIR difference spectra obtained by subtracting the IR spectrum of water from those of soybean seads.
Band component analysis of the 1700-1500 cm-1 region of the IR spectrum of M 150-2 after subtracted water bands.
Band component analysis of the 1700-1500 cm-1 region of IR spectrum of control group soybean seed after subtracted water bands.
1746 cm-1band corresponds to the pectin ester C=O stretching 1652-1653cm-1 ; amid1 alpha helix, 1540-1544cm-1 ; amid II alpha helix 1175 cm-1; cellulose 1124-1114; 1019 cm-1characteristic bands of pectic polysaccharides, 1072 cm-1 carbohydrates (C-C, C-O stretching) 724 cm-1(CH2) mode of lipids
The Infrared difference spectra between salt tolarant mutant and control soybean seeds indicate that lipid and cellulose components increase but protein (particularly α-helix) structure decreases in mutant seeds in comparison to control seeds.
C 1480-880 cm-1 region
Protein alpha helices structure is strongly positively and lipid is negatively associated with PC1.
Inordertorevealthedissimilaritiesbetweencontrolgroupseedsand salt tolarantmutants, Hierarchical Average linkage cluster analysis were performed on the 3030-2800 and 1800-900 cm-1 regions of the vector normalized IR spectra (water bands were subtracted) using Euclidean distance. 2 point straight baseline corrections between 3030-2800 cm-1, 1800-1482 cm-1, 1482-1202 cm-1, 1202-900 cm-1 regions, were applied. Thedendrongram is as follows: