Download
1 / 24
240 likes | 420 Views
SOUTHERN ACIDS (M) BERHAD. DELIVERING QUALITY SINCE 1981. Analyst & Press Briefing. Financial Results 2 nd Quarter ended 31 st October 2010. 10 December 2010. Disclaimer Notice. This presentation may contain projections and forward looking statements. Such

E N D
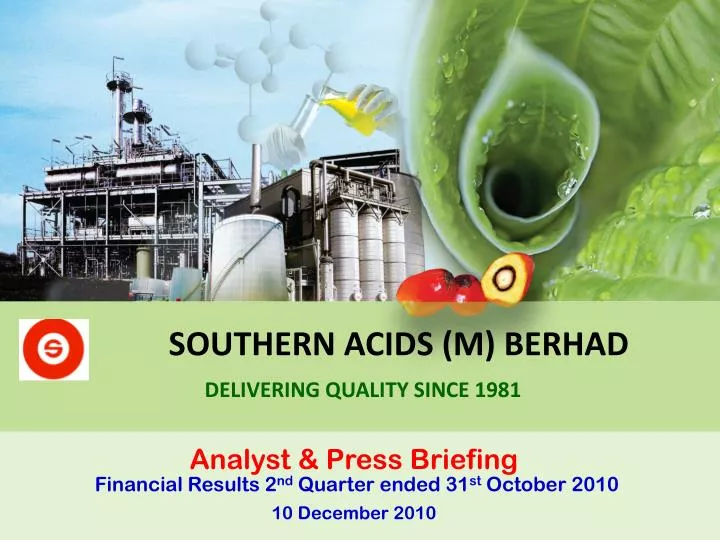
SOUTHERN ACIDS (M) BERHAD DELIVERING QUALITY SINCE 1981 Analyst & Press Briefing Financial Results 2nd Quarter ended 31st October 2010 10 December 2010
Disclaimer Notice This presentation may contain projections and forward looking statements. Such statements are based on current circumstances and assumptions which may change over time. Accordingly no reliance should be placed on any of these projections and forward looking statements, express or implied in this presentation. 1
Presentation Contents • Operating Business Divisions 2. 2nd Quarter Group Financial Highlights 3. Review of Major Operations 4. Business Outlook 5. Share Price Performance
FINANCIAL RESULTS 2nd QUARTER ENDED 31 OCT 2010 Oleochemical Palm Oil Plantation Healthcare Warehousing & Port Cargo Handling Investment & Management Operating Business Segments
2nd Quarter Group Financial Highlights
3 months Oct 2010 (RM’000) 3 months Oct 2009 (RM’000) Change 15.72% FINANCIAL RESULTS FOR THE 3 MONTHS ENDED 31 OCT 2010 Revenue 128,599 111,134 1,983 653.40% Profit before tax 14,940 762.74% 11,509 1,334 Profit for the period after tax Total comprehensive income for the period 15,129 1,334 1,034.11% 1,826.66% 0.30 sen Earnings per share (EPS) 5.78 sen 5
FINANCIAL RESULTS FOR THE 6 MONTHS ENDED 31 OCT 2010 6 months Oct 2010 (RM’000) 6 months Oct 2009 (RM’000) Change 17.39% Revenue 257,830 219,639 26,638 11,871 124.40% Profit before tax 129.84% 19,523 8,494 Profit for the period after tax Total comprehensive income for the period 191.66% 24,774 8,494 128.05% 4.35 sen Earnings per share (EPS) 9.92 sen
Total Group Revenue (RM’000) Revenue up mainly on higher sales volume and average selling prices recorded by the oleochemical and plantation divisions. 7
Group Profit before Tax (RM’000) Profit before tax up mainly on higher sales and better margin earned on sales recorded by the oleochemical and the plantation divisions. 8
Revenue by Business Segment 3 Months ended 31 Oct 2010 (RM’000) 9
Revenue by Business Segments 6 Months ended 31 Oct 2010 (RM’000) 10
Pre-Tax Profit/Loss by Business Segment 3 months ended 31 Oct 2010(RM’000) Better results were recorded by all major operating divisions for the 2nd quarter ended FY 2011 save for the warehousing and conveying business who registered a small reduction in profit compared to FY 2010 results.11
Pre-Tax Profit/Loss by Business Segment 6 months ended 31 Oct 2010(RM’000) Better results were recorded by all major operating divisions for the 6 months ending FY 2011 save for the warehousing and conveying business who registered a small reduction in profit compared to the FY 2010 results.12
Review Of Major Operations
Review of Major Operations 17.46% • Oleochemical • Demand for the division’s oleochemical products remained strong in the six months financial year ending 2011 because of the aggressive marketing & pricing strategy and dynamic production modules to suit customers’ needs. • Revenue for the six months ending 2011 was higher by 17.46% compared to year ended 2010 as a result of higher sales volume and higher average selling price realised on sales. • Pre-tax profit was also significantly higher at RM7.2 million in the six months for the current financial year because of higher sales and a forex gain in FY2011 as compared to a forex loss in FY2010. 324.15%
Review of Major Operations 33.16% • Palm Oil Plantation • The much improved results recorded by the division for the 6 months ending FY2011 is mainly due to higher production and sales volume, higher CPO selling prices achieved and profit margin earned on sales. • Increased FFB quantities processed. • Oil Extraction Rate (OER) achieved in the 1st 6-months was 23.35%. 111.93%
Review of Major Operations RM’000 • Private Healthcare • The Healthcare division has now registered profit in two consecutive quarters in FY2011 as against the two quarter of losses recorded in the previous corresponding periods in FY2010. • The improved results is contributed mainly by the higher in-patient revenue recorded in the 1st 6-months of FY2011. • The division is continuing with its efforts to aggressively market itself as a tertiary hospital of choice in the surrounding areas in Klang & Indonesia besides initiatives to also tap into the regional medical tourism market to broaden its income base. 10.16% 172.99%
Review of Major Operations RM’000 • Warehouse & Conveying • Revenue and pre-tax profit from the warehousing and conveying division reduced marginally during the six months of FY2011 as against the previous corresponding six months in FY2010, mainly because of lower throughput handled by the division in FY2011 against FY2010. 22.84% 6.97%
Business Outlook • Oleochemical • SAB’s oleo-chemical division is likely to enjoy robust growth in 2010 -2012 in tandem with industry trends in Southeast Asia, fuelled by a short-term hike in demand from consumer markets and wider availability of raw materials such as palm oil, palm kernel oil. • Growing markets for green chemicals and uses in new applications (eg. bio-lubricants, green chemicals, bio-plastics and biopolymers) may stimulate long-term growth in the regional oleochemical industry. • Prices of fatty acids in Asia are dependent on feedstock palm kernel, palm stearin and CPO prices and tend to follow the price trends of these raw materials. • Oil Palm Plantation • SAB’s plantation division is expected to benefit in the next financial quarter FY2011 from the current hike in CPO prices which is trading at above RM3,500/mt.18
Business Outlook • Private Health Care • SAB’s Private Health Care Division’s turnaround of financial performance during the 1st & 2nd financial quarters FY2011 stems from its aggressive marketing campaign and success in winning support from its corporate clients. • The Private Health Care Division is poised to take advantage of the growing medical tourism market in the region in the long term. Performance for the 3rd financial quarter FY2011 is expected to hold steady although seasonal influence of the festive period during the 3rd quarter may have a moderate impact on patient flow. • Warehousing & Port Cargo Services • SAB’s Warehousing & Conveying Division is expected to hold its current performance in tandem with demand for palm kernel expeller (pke) in the world market. 19
Business Outlook • The Group’s 2nd quarter results was an improvement over the 1st quarter, and the 1st 6-months results (FY2011) surpassed that of the previous corresponding period (FY2010) both in terms of revenue and profitability. • Barring any unforeseen circumstances, we are optimistic that the Group will be able to sustain its current performance throughout the entire financial year. 20
Share Price Performance
Questions & Answers Thank you