Download
1 / 1

E N D
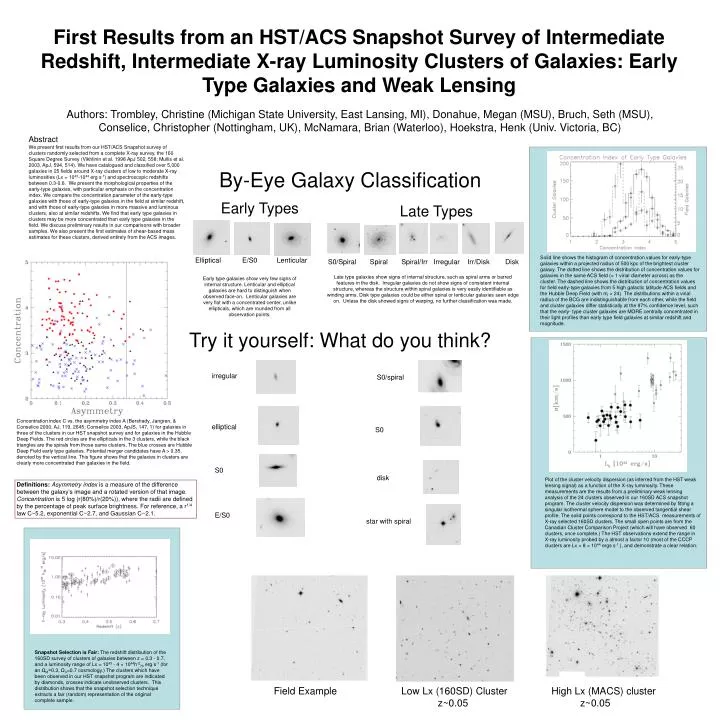
Snapshot Selection is Fair: The redshift distribution of the 160SD survey of clusters of galaxies between z = 0.3 - 0.7, and a luminosity range of Lx = 1043 - 4 × 1044h-270 erg s-1 (for an ΩM=0.3, ΩΛ=0.7 cosmology.) The clusters which have been observed in our HST snapshot program are indicated by diamonds, crosses indicate unobserved clusters. This distribution shows that the snapshot selection technique extracts a fair (random) representation of the original complete sample. Authors: Trombley, Christine (Michigan State University, East Lansing, MI), Donahue, Megan (MSU), Bruch, Seth (MSU), Conselice, Christopher (Nottingham, UK), McNamara, Brian (Waterloo), Hoekstra, Henk (Univ. Victoria, BC) First Results from an HST/ACS Snapshot Survey of Intermediate Redshift, Intermediate X-ray Luminosity Clusters of Galaxies: Early Type Galaxies and Weak Lensing Abstract We present first results from our HST/ACS Snapshot survey of clusters randomly selected from a complete X-ray survey, the 160 Square Degree Survey (Vikhlinin et al. 1998 ApJ 502, 558; Mullis et al. 2003, ApJ, 594, 514). We have catalogued and classified over 5,000 galaxies in 25 fields around X-ray clusters of low to moderate X-ray luminosities (Lx = 1043-1044 erg s-1) and spectroscopic redshifts between 0.3-0.6. We present the morphological properties of the early-type galaxies, with particular emphasis on the concentration index. We compare the concentration parameter of the early-type galaxies with those of early-type galaxies in the field at similar redshift, and with those of early-type galaxies in more massive and luminous clusters, also at similar redshifts. We find that early type galaxies in clusters may be more concentrated than early type galaxies in the field. We discuss preliminary results in our comparisons with broader samples. We also present the first estimates of shear-based mass estimates for these clusters, derived entirely from the ACS images. By-Eye Galaxy Classification Early Types Late Types Solid line shows the histogram of concentration values for early-type galaxies within a projected radius of 500 kpc of the brightest cluster galaxy. The dotted line shows the distribution of concentration values for galaxies in the same ACS field (< 1 virial diameter across) as the cluster. The dashed line shows the distribution of concentration values for field early-type galaxies from 5 high galactic latitude ACS fields and the Hubble Deep Field (with mi < 24). The distributions within a virial radius of the BCG are indistinguishable from each other, while the field and cluster galaxies differ statistically at the 97% confidence level, such that the early- type cluster galaxies are MORE centrally concentrated in their light profiles than early type field galaxies at similar redshift and magnitude. Elliptical E/S0 Lenticular S0/Spiral Spiral Spiral/Irr Irregular Irr/Disk Disk Late type galaxies show signs of internal structure, such as spiral arms or barred features in the disk. Irregular galaxies do not show signs of consistent internal structure, whereas the structure within spiral galaxies is very easily identifiable as winding arms. Disk type galaxies could be either spiral or lenticular galaxies seen edge on. Unless the disk showed signs of warping, no further classification was made. Early type galaxies show very few signs of internal structure. Lenticular and elliptical galaxies are hard to distinguish when observed face-on. Lenticular galaxies are very flat with a concentrated center, unlike ellipticals, which are rounded from all observation points. Try it yourself: What do you think? irregular S0/spiral Concentration index C vs. the asymmetry index A (Bershady, Jangren, & Conselice 2000, AJ, 119, 2645; Conselice 2003, ApJS, 147, 1) for galaxies in three of the clusters in our HST snapshot survey and for galaxies in the Hubble Deep Fields. The red circles are the ellipticals in the 3 clusters, while the black triangles are the spirals from those same clusters. The blue crosses are Hubble Deep Field early type galaxies. Potential merger candidates have A > 0.35, denoted by the vertical line. This figure shows that the galaxies in clusters are clearly more concentrated than galaxies in the field. elliptical S0 S0 disk Plot of the cluster velocity dispersion (as inferred from the HST weak lensing signal) as a function of the X-ray luminosity. These measurements are the results from a preliminary weak lensing analysis of the 24 clusters observed in our 160SD ACS snapshot program. The cluster velocity dispersion was determined by fitting a singular isothermal sphere model to the observed tangential shear profile. The solid points correspond to the HST/ACS measurements of X-ray selected 160SD clusters. The small open points are from the Canadian Cluster Comparison Project (which will have observed 60 clusters, once complete.) The HST observations extend the range in X-ray luminosity probed by a almost a factor 10 (most of the CCCP clusters are Lx > 8 × 1044 ergs s-1.), and demonstrate a clear relation. Definitions:Asymmetry index is a measure of the difference between the galaxy’s image and a rotated version of that image. Concentration is 5 log (r(80%)/r(20%)), where the radii are defined by the percentage of peak surface brightness. For reference, a r1/4 law C~5.2, exponential C~2.7, and Gaussian C~2.1. E/S0 star with spiral Field Example Low Lx (160SD) Cluster z~0.05 High Lx (MACS) clusterz~0.05