Download
1 / 41
410 likes | 415 Views
‘. Vertex Reconstruction Algorithms in the PHOBOS Experiment at RHIC Krzysztof Woźniak for the PHOBOS Collaboration Institute of Nuclear Physics Polish Academy of Sciences Kraków. ‘. Collaboration.

E N D
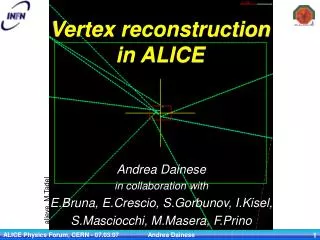
‘ Vertex Reconstruction Algorithms in the PHOBOS Experiment at RHIC Krzysztof Woźniak for the PHOBOS Collaboration Institute of Nuclear Physics Polish Academy of Sciences Kraków K.Woźniak TIME 2005
‘ Collaboration Burak Alver, Birger Back,Mark Baker, Maarten Ballintijn, Donald Barton, Russell Betts, Richard Bindel, Wit Busza (Spokesperson), Zhengwei Chai, Vasundhara Chetluru, Edmundo García, Tomasz Gburek, Kristjan Gulbrandsen, Clive Halliwell, Joshua Hamblen, Ian Harnarine, Conor Henderson, David Hofman, Richard Hollis, Roman Hołyński, Burt Holzman, Aneta Iordanova, Jay Kane,Piotr Kulinich, Chia Ming Kuo, Wei Li, Willis Lin, Constantin Loizides, Steven Manly, Alice Mignerey, Gerrit van Nieuwenhuizen, Rachid Nouicer, Andrzej Olszewski, Robert Pak, Corey Reed, Eric Richardson, Christof Roland, Gunther Roland, Joe Sagerer, Iouri Sedykh, Chadd Smith, Maciej Stankiewicz, Peter Steinberg, George Stephans, Andrei Sukhanov, Artur Szostak, Marguerite Belt Tonjes, Adam Trzupek, Sergei Vaurynovich, Robin Verdier, Gábor Veres, Peter Walters, Edward Wenger, Donald Willhelm, Frank Wolfs, Barbara Wosiek, Krzysztof Woźniak, Shaun Wyngaardt, Bolek Wysłouch ARGONNE NATIONAL LABORATORY BROOKHAVEN NATIONAL LABORATORY INSTITUTE OF NUCLEAR PHYSICS PAN, KRAKOW MASSACHUSETTS INSTITUTE OF TECHNOLOGY NATIONAL CENTRAL UNIVERSITY, TAIWAN UNIVERSITY OF ILLINOIS AT CHICAGO UNIVERSITY OF MARYLAND UNIVERSITY OF ROCHESTER K.Woźniak TIME 2005
‘ Heavy Ion Collisions at RHIC • central Au+Au collision at sNN = 200 GeV • large number of produced particles (>>1000) • large rapidity coverage • collisions of two beams – vertices spread along beam line (1 m) K.Woźniak TIME 2005
‘ Basic Concepts of PHOBOS Detector Design • register produced charged particles in very large rapidity range • measure precisely ~1% of particles in two arm magnetic spectrometer • determine the vertex position using specialized vertex detector K.Woźniak TIME 2005
‘ vertex detector spectrometer octagon PHOBOS Detector Subsystems K.Woźniak TIME 2005
‘ Subsystems Used in Vertex Reconstruction • spectrometer • (x, y, z) • vertex detector • (-, y, z) • multiplicity detector (octagon) • (-, -, z) • trigger detectors • (-, -, z) K.Woźniak TIME 2005
‘ Trigger Counters • Trigger system (scintilator or Cerenkov counters) is used for on-line selection of the vertex position range • accuracy and efficiency of vertex determination to small to be useful for off-line reconstruction Reconstruction error (Zv) 5 cm K.Woźniak TIME 2005
‘ Spectrometer • 8 first layers of spectrometer used for vertex reconstruction • silicon sensors with pads 1x1 mm2 and 0.427x6 mm2 • negligibly small magnetic field – straight line tracks reconstructed • track direction in 3D is well determined Reconstruction error (Zv) 0.2-0.3 cm K.Woźniak TIME 2005
‘ Spectrometer – 3D Method Z - X • Straight line part of reconstructed tracks used to calculate common vertex of all tracks in 3D • find approximate vertex position minimizing sum of distances • reject tracks too far from approximate vertex • repeat fit using only „good” tracks K.Woźniak TIME 2005
‘ Spectrometer – 2D + 1D Method • Uses points of closest approach for all pairs of tracks: • make X-Z and Y histograms for points compatible with beam orbit • find maxima of both histograms – approximate position of the vertex • calculate mean values of X, Y, Z using only points close to approximate vertex Z - X K.Woźniak TIME 2005
‘ Vertex Detector • four layers of silicon sensors, in two pairs below and under beam pipe • strips perpendicular to the beam direction, 473 m wide, 1.2 cm (inner layers) and 2.4 cm (outer layers) long, to ensure the same angle coverage X-Y view Reconstruction error (Zv)< 0.2 cm K.Woźniak TIME 2005
‘ Vertex Detector • hypothetical tracks are extrapolated to fixed Y and histogram of Z values are created • vertex position in Z = maximum of the histogram • procedure is repeated for several Y values • Y position is determined by selecting the Z histogram with best maximum • results of vertex fit are used for quality cuts K.Woźniak TIME 2005
‘ Octagonal Multiplicity Detector • single layer of silicon sensors covering 110 cm along the beam pipe • pads 0.27 cm long in Z, 0.87 cm long in X-Y plane (covering 32 bins in angle) • primary particles traverse only one sensor • any use for vertex reconstruction?? K.Woźniak TIME 2005
‘ Zv = 15 cm Zv = 0 cm Zv = -13 cm Octagonal Multiplicity Detector • hit density largest close to the vertex position • the error > 5 cm K.Woźniak TIME 2005
‘ Octagonal Multiplicity Detector • Geometrical calculations: • particles traverse one, two or more pads, depending on the emission angle – and thus distance of the hit from the vertex • in case of multiple pad hits two ranges of vertex position are possible • overlap of many hits points to the vertex For the octagonal multiplicity detector: (Zhit-Zv) 15 cm K.Woźniak TIME 2005
‘ E = ~ 1.2 MIP E = ~3 MIP E = ~6 MIP E = ~15 MIP E = ~30 MIP Octagonal Multiplicity Detector • energy loss Eregistered in silicon depends on the length of the particle trajectory – and this on emission angle • for PHOBOS octagonal multiplicity detector the uncertainty of the Zhit-Zv distance is smaller than from geometrical calculations K.Woźniak TIME 2005
‘ Octagonal Multiplicity Detector Calibration of Zhit-Zv distance and the width of the distribution (Zhit-Zv)< 15 cm Reconstruction error (Zv) 1 cm K.Woźniak TIME 2005
‘ Octagon I Method Example of three primary particles emitted at different angles which deposit different amount of energy in silicon sensors • for each hit two ranges of compatible vertex positions can be defined • at hypothetical vertex positions the number of compatible hits is counted • at the real vertex position the maximum of the histogram is expected • the position of the maximum is fitted to improve it’s precision K.Woźniak TIME 2005
‘ Octagon II Method Example of three primary particles emitted at different angles which deposit different amount of energy in silicon sensors • for each hit two vertex positon probability distributions are defined • at hypothetical vertex positions the sum of probability values is calculated • at the real vertex position the maximum of the histogram is expected • the maximum is accepted when it is high enough and sufficiently higher than the continuum K.Woźniak TIME 2005
‘ Octagon III Method Example of three primary particles emitted at different angles which deposit different amount of energy in silicon sensors • for each hit two vertex positon probability distributions are defined • at hypothetical vertex positions the values of probability are multiplied • at the real vertex position a distinct maximum of the histogram is expected K.Woźniak TIME 2005
‘ Results Results of vertex reconstruction for Au+Au collisions at sNN = 200 GeV K.Woźniak TIME 2005
‘ Acceptance in Z – Au+Au 200 GeV Spectrometer Vertex Octagon Z < 3 cm Z < 0.2 cm Z < 0.2 • red histogram for events with incorrectly reconstructed vertex • for vertex detector such events can be rejected after comparison with Octagon results K.Woźniak TIME 2005
‘ Vertex Reconstruction Accuracy |Zv| < 10 cm the most central Au+Au collisions at 200 GeV (15%) – according to the number of charged primary particles in octagonal multiplicity detector acceptance * all errors in cm K.Woźniak TIME 2005
‘ Vertex Reconstruction Accuracy |Zv| < 10 cm the most peripheral Au+Au collisions at 200 GeV (30%)– according to the number of charged primary particles in octagonal multiplicity detector acceptance(errors for the central events are also given for comparison) * all errors in cm K.Woźniak TIME 2005
‘ MC and Real Data Comparison (Zv) from vertex detector is the smallest – we can use it in place of real vertex position In ~50 % of Au+Au events with |Zv|< 10 all methods find vertices The error of Zvertex (Zvertex-ZMC) = 0.007 cm is negilgible in these calculations (Zvertex-Zmethod) is similar in real data and MC K.Woźniak TIME 2005
‘ Reconstruction Efficiency |Zv| < 10 cm Spectrometer 3D Spectrometer 2D+ 1D Z < 0.5 cm Z < 0.5 cm Vertex Octagon Z < 3 cm Z < 0.5 cm primaries = number of all charged primary particles with hits K.Woźniak TIME 2005
‘ Reconstruction Efficiency |Zv| < 10 cm Spectrometer 3D Spectrometer methods start to reconstruct vertex from 2 tracks Vertex method needs at least 3 tracks and is about 80% efficient from 5 tracks Z < 0.2 cm Spectrometer 2D+ 1D Vertex primaries = number of charged primary particles in spectrometer or vertex acceptance (respectively) K.Woźniak TIME 2005
‘ Reconstruction Efficiency |Zv| < 10 cm Octagon I Octagon III method efficiently reconstructs vertices in events with > 10 primary tracks Other methods need > 40 primary tracks Octagon II Octagon III Z < 3 cm primaries = number of charged primary particles in octagon acceptance, about 35% of events in the range shown K.Woźniak TIME 2005
‘ Results – Different Energy or Beams • Results of vertex reconstruction • for Au+Au collisions at sNN = 19.6 GeV • for Cu+Cu collisions at sNN = 200 GeV • for d+Au collisions at sNN = 200 GeV • for p+p collisions at sNN = 200 GeV K.Woźniak TIME 2005
‘ Acceptance in Z - Au+Au 19.6 GeV Spectrometer Vertex Octagon Z < 3 cm Z < 0.2 Z < 0.2 cm • red histogram for events with incorrectly reconstructed vertex • for vertex detector such events can be rejected after comparison with Octagon results K.Woźniak TIME 2005
‘ Acceptance in Z - Cu+Cu 200 GeV Spectrometer Vertex Octagon Z < 3 cm Z < 0.2 cm Z < 0.2 • red histogram for events with incorrectly reconstructed vertex • for vertex detector such events can be rejected after comparison with Octagon results K.Woźniak TIME 2005
‘ Acceptance in Z - d+Au 200 GeV Spectrometer Vertex Octagon Z < 0.2 Z < 3 cm Z < 0.2 cm • red histogram for events with incorrectly reconstructed vertex • for vertex detector such events can be rejected after comparison with Octagon results K.Woźniak TIME 2005
‘ Acceptance in Z - p+p 200 GeV Spectrometer Vertex Octagon Z < 3 cm Z < 0.2 cm Z < 0.2 • red histogram for events with incorrectly reconstructed vertex • for vertex detector such events can be rejected after comparison with Octagon results K.Woźniak TIME 2005
‘ Summary K.Woźniak TIME 2005
‘ Conclusions • reconstruction of the vertex in collisions of heavy nuclei is easy – due to the large number of primary particles • small acceptance detectors can be used in the reconstruction without significant loss of precision • the main problem is proper selection of „good” tracks, especially in the events with low multiplicities • in the collider experimentssingle layer silicon detector can be used to obtain position of the vertex with the error smaller than 1 cm • agreement of methods using different parts of the detector is necessary for rejection of poorly reconstructed vertices K.Woźniak TIME 2005
‘ Tracking in Spectrometer z By Beam 1) find straight tracks in the field-free region 2) curved tracks found in B field by clustering in (1/p, ) space 3) Pieces matched 4) Momentum fit using the full track, and detailed field map 5) Quality cuts, DCA cuts 2 1 x 10 cm K.Woźniak TIME 2005
‘ Particle Identification in Spectrometer Particle identification based on dE/dx measurements in Si sensors (resolution 7%) p Positive charges Negative charges K+ p K— + — K.Woźniak TIME 2005
‘ 70 cm 10 cm z -x y Identified Particles from Spectrometer Acceptance of the spectrometer y pT (GeV/c) B=2T 0.35 – 1.3 0.10 – 0.6 0.25 – 0.8 0.10 – 0.5 0.20 – 0.7 0.15 – 0.9 K p,p Momentum resolution 1 – 2 % Reversible 2T magnetic field Two symmetric spectrometer arms K.Woźniak TIME 2005
‘ Tracking in Spectrometer – High pT Acceptance Momentum resolution K.Woźniak TIME 2005
‘ F E D C B A X[cm] Beam pipe Z[cm] Search for particles stopping in the 5th spectrometer plane Particles with Very Low pT Mass measurements (‘energy-range’ method) 20 • Cuts on dE/dxper plane mass hypothesis 10 0 • Cuts on Eloss(Ek=kinetic energy) momentum hypothesis 0 10 20 Z [cm] • Corrections acceptance, efficiency absorption, background MC P Ek=21 MeV K Ek=19 MeV dE/dx Ek= 8 MeV • Eikin=dEi+dEi+1+dEi+2… • Mip= dE/dxi * Eikinm • (1/2) ( m2) A B C D E K.Woźniak TIME 2005 silicon plane
‘ Au+Au sNN=200 GeV 15% central Particles with Very Low pT Test of the method: Reconstruction of low momentum MC particles p+p K++K– ++ DATA MC K.Woźniak TIME 2005