Download
1 / 25
251 likes | 425 Views
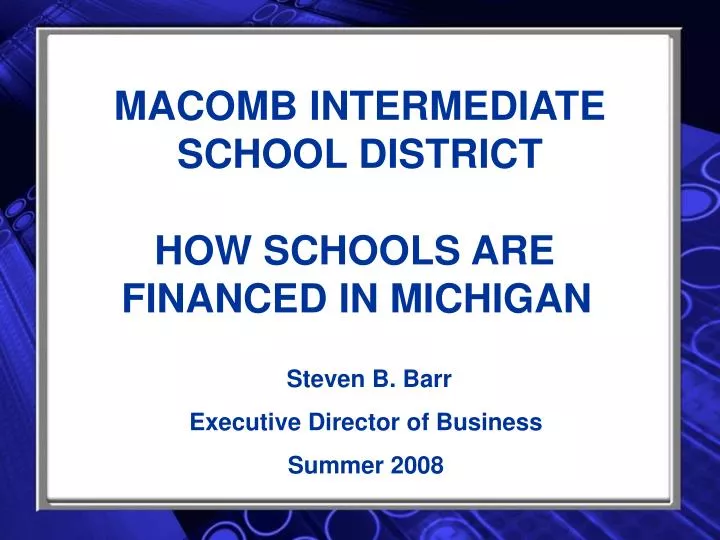
MACOMB INTERMEDIATE SCHOOL DISTRICT. HOW SCHOOLS ARE FINANCED IN MICHIGAN. Steven B. Barr Executive Director of Business Summer 2008. FUNDING SOURCES. Local Property Tax State Aid Federal Grants MISD Transfers. WHY WE ARE – WHERE WE ARE.

E N D
MACOMB INTERMEDIATE SCHOOL DISTRICT HOW SCHOOLS ARE FINANCED IN MICHIGAN Steven B. Barr Executive Director of Business Summer 2008
FUNDING SOURCES • Local Property Tax • State Aid • Federal Grants • MISD Transfers
WHY WE ARE – WHERE WE ARE On July 21, 1993, with PA 145, the legislature wiped out 2/3rds of public school operating revenues (~7.0 Billion Dollars).On March 15, 1994, the people of Michigan, by a 2 to 1 margin, approved “PROP A” which was an increase in the sales tax from 4 to 6%. This shift in funding responsibility from the local level to the state level also involved other elements:
THE PEOPLE VOTED TO: 1993Proposal A Sales Tax 4% 6% Income Tax 4.6% 4.4% Property Tax (mills) Homestead 34(ave) 6 Second Homes 34(ave) 24 Industrial/commercial 34 24 Enhancement na 3* Assessment Cap na 5% Real Estate Transfer Tax .0011% .75% Cigarette Tax $.25 $.75 Out of State calls 4% 6% * Only available 1994-95, 1995-96, 1996-97 In 1997-98 became regional enhancement
REVENUE SHIFTS SOURCE 19932007 LOCAL 74% 23% STATE 26% 77%
THE SCHOOL AID FUND 199520012007 Sales and Use Tax 46% 48% 41% State Education Tax 13 18 16 Income Tax 10 19 16 Tobacco Tax 5 4 4 Lottery 6 5 6 General Fund 17 1 0 Federal 1 1 11 Other 2 4 6 100% 100% 100%
ONE OBJECTIVE OF PROPOSAL A • Reduced Spending Gap- • 1993 • Lowest 10 districts averaged $3,476/pupil • Highest 10 districts averaged $9,726/pupil • 179% difference • 2008 • Lowest 10 districts averaged $7,204/pupil • Highest 10 districts averaged $11,934/pupil • 66% difference
THE FOUNDATION ALLOWANCE MinBasicPSA MaxHold Harmless 1995 4,200 5,000 5,500 6,500 1996 4,506 5,153 5,653 6,653 1997 4,816 5,308 5,808 6,808 1998 5,124 5,462 5,962 6,962 1999 5,170 5,462 5,962 6,962 2000 5,700 5,700 6,200 7,200 2001 6,000 6,000 6,500 7,500 2002 6,500 6,500 6,800 7,800 2003 6,700 6,700 7,000 8,000 2004 6,700 6,700 7,000 8,000 2005 6,700 6,700 7,000 8,000 2006 6,875 6,875 7,175 8,175 2007 7,085 7,085 7,385 8,385 2008 7,204 up to 8,433 7,475 8,433 Macomb County $ 7,204 to $ 9,978
BLENDED COUNT Fourth Friday in September 1995 50/50 1996 50/50 1997 50/50 1998 40/60 1999 40/60 2000 25/75 2001 20/80 2002 20/80 2003 20/80 2004 20/80 2005 25/75 2006 25/75 2007 25/75 2008 25/75 Fourth Wednesday after Labor Day 9-26-07 “The Count Day” Second Wednesday in February 2-13-08 “Supplemental Count Day” Average Daily Attendance
BLENDED COUNT 2007-2008 FEBRUARY 2007 6,000 x 25 % = 1,500 SEPTEMBER 2007 6,400 x 75 % = 4,800 6,300 FEBRUARY 2004 6,000 x 20 % = 1,200 SEPTEMBER 2004 6,400 x 80 % = 5,120 6,320 LOSS OF 20 FTEs @ $8,050 = $161,000.
FOUNDATION ALLOWANCE CALCULATIONS Calculation of Foundation Allowance Revenue (Section 20) The total amount of state aid a district will receive for foundation allowances is calculated in Section 20. It is derived from multiplying the number of general education membership pupils a district educates by the district’s foundation allowance, then subtracting the local revenue from levying 18.0 mills. (See note below regarding pupil membership.) Note that the state pays only a portion of a district’s foundation allowance revenue-it pays the amount remaining after subtracting from the foundation allowance amount the local revenue the district collects from its “nonhomestead” property tax. This tax is equal to 18 mills or the number of mills a district levied in 1993, whicheveris less, multiplied by the non homestead taxable value (taxable value from business and second homes) in the district. Foundation allowance calculation (Sec.20): FY 2007-08 State {General Education The lesser of $8433 } Local Revenue from levying 18.0 mills* Portion = { X or the District’s } on nonhomestead property {Membership Pupils Foundation Allow. } *Or the number of school operating mills levied in 1993, whichever is less. Example of FY 2006-07 Sec. 20 Calculation FY 2007-08 Foundation = $7,200 General Education Membership = 1,000 Local Revenue from Nonhomestead Property Tax -= $2,000,000 State and Location Foundation Allowance Revenue = $7,200 X 1,000 = $7,200,000 State Portion of Foundation Allowance Revenue = $7,200,000 - $2,000,000 = $5,200,000 State Portion Per Pupil = $5,200,000 ÷ $1,000 = $5,200 There is a maximum amount, called the state maximum foundation allowance, which may be used when calculating the state portion of the foundation allowance. This is the highest foundation allowance that may be used when multiplying the number of general education membership pupils by a district’s foundation allowance to calculate total revenue (as described above). The state maximum foundation revenue was set at $1,500 above the basic foundation allowance each year until FY 2002-03. Beginning in FY 2002-03, the first year following the equity payment, the state maximum foundation is $1,300 above the foundation allowance, which for FY 2006-07 was $8,385 per pupil. Beginning 2007-08 this difference is variable because of the 2X formula. (Districts with a foundation allowance above the state maximum – so-called “hold harmless” districts – must levy additional local millages to make up the difference between this $8433 maximum and their foundation allowances.)
2x FORMULA • Foundations at the minimum will increase by twice the amount of those at state max • Those in between on a sliding scale
STATE AID CATEGORICALS • 11F NONPLAINTIFF DURANT SETTLEMENT • 22a PROP A OBLIGATION-(State portion of Foundation) • 22b DISCRETIONARY PAYMENT-(State portion of Foundation) • 24 COURT PLACED CHILDREN • 26a RENAISSANCE ZONE-(State portion of Foundation) • 29 DECLINING ENROLLMENT • 31A AT RISK • 31d SCHOOL LUNCH • 32d MICH SCHOOL READINESS • 51c SPEC ED HEADLEE OBLIGATION • 53a COURT AND STATE AGENCY PLACED PUPIL • 61a.1 VOCATIONAL EDUCATION • 61a.2 VOC. ED. ADMINISTRATION • 99k DISTRICT GRANTS • 107.1 ADULT EDUCATION PARTICIPANTS
FEDERAL GRANTS • Title I • School Lunch/Breakfast • IDEA (Special Ed) • Safe and Drug Free Schools • Voc Ed • Adult Ed • Title III
TRANSFERS • MISD Act 18 Millage Distribution • MISD Act 18 Center Program Reimbursement
SOURCES OF REVENUE FOR CAPITAL IMPROVEMENTS • Sinking Funds • Non-Qualified Bonds • Qualified Bonds (State Guarantee)
DEBT RETIREMENT $25,000,000 Elementary School is amortized over 25 years. The payments for principal would be $1,000,000 per year. First year costs: December Bonds $500,000 Interest @ 4 % 500,000 Paying Agent fees 500 June Bonds 500,000 Interest @ 4 % 490,000 Paying Agent fees 500 TOTAL $1,991,000 First year millage : Total T.V. of District $ 700,000,000 $1,991,000 / $ 700,000,000 = .00284 (or 2.84 mills)
CASH FLOW • Property taxes-July thru December • State Aid-11 Payments (Oct to Aug) • School Bond Loan Fund
MAJOR COST COMPONENTS • Salary • Health Insurance Coverage • Retirement System
MPSERS RETIREMENT RATES fy 2002fy 2003fy 2004fy 2005fy 2006fy 2007fy 2008fy2009 Health Costs 6.05 6.05 6.05 6.55 6.55 6.55 6.55 6.81 Pensions 6.06 6.26 6.26 6.31 5.47 5.49 5.28 5.17 Unfunded Pen. .06 .68 .68 2.01 4.32 5.70 4.89 4.56 Subsidized .00.001.38 1.73 .481.00 .00 .00 Full Rate 12.17 12.99 14.37 16.60 6.82 18.74 16.72 16.54 Less sub. -1.38- 1.73-.48-1.00 .00 .00 .00 .00 Rate Charged 12.17 12.99 12.99 14.87 16.34 17.74 16.72 16.54
SOURCES OF INFORMATION • MDE Website • Annual Bulletin 1011 and 1014 • Historical Information • Links to House and Senate Fiscal Agency • State Aid Act with Appendices • MISD Website-Summaries and Surveys • MSBO Website-School Finance Reference Manual