1 / 7

t = 135 years

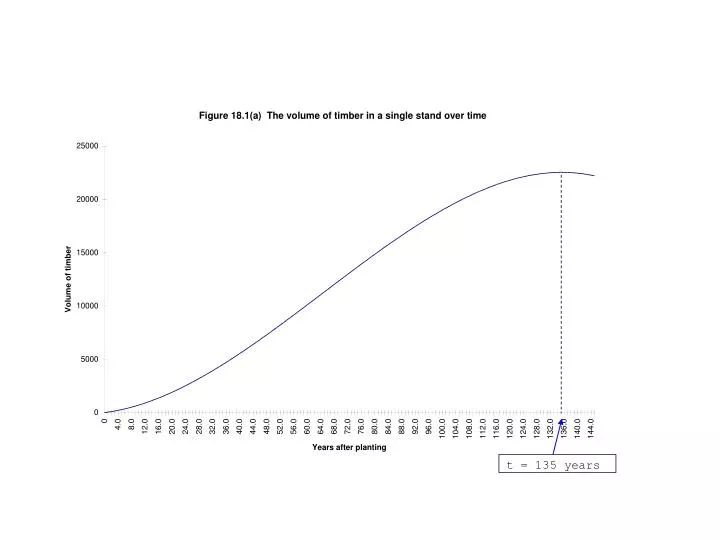
t = 135 years. Figure 18.1(b) Biological growth of a single stand of timber. 300. 250. 200. 150. G(S). 100. 50. 0. 0. 5000. 10000. 15000. 20000. 25000. -50. Stock, S. 240. 11,300. i. Figure 18.5 Incremental change in value and costs with rotation stand age.

hina
Download Presentation

t = 135 years

An Image/Link below is provided (as is) to download presentation Download Policy: Content on the Website is provided to you AS IS for your information and personal use and may not be sold / licensed / shared on other websites without getting consent from its author. Content is provided to you AS IS for your information and personal use only. Download presentation by click this link. While downloading, if for some reason you are not able to download a presentation, the publisher may have deleted the file from their server. During download, if you can't get a presentation, the file might be deleted by the publisher.

E N D

Presentation Transcript


  1. t = 135 years

  2. Figure 18.1(b) Biological growth of a single stand of timber. 300 250 200 150 G(S) 100 50 0 0 5000 10000 15000 20000 25000 -50 Stock, S 240 11,300

  3. i

  4. Figure 18.5 Incremental change in value and costs with rotation stand age.

More Related