Download
1 / 59
600 likes | 818 Views
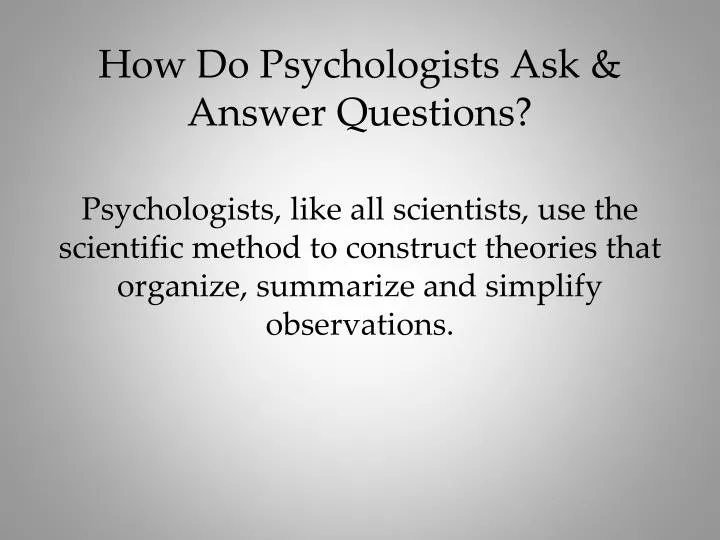
How Do Psychologists Ask & Answer Questions?. Psychologists, like all scientists, use the scientific method to construct theories that organize, summarize and simplify observations. Theory. A theory is an explanation that integrates principles and organizes and predicts behavior or events.

E N D
How Do Psychologists Ask & Answer Questions? Psychologists, like all scientists, use the scientific method to construct theories that organize, summarize and simplify observations.
Theory A theory isan explanation that integrates principles and organizes and predicts behavior or events. For example, low self-esteem contributes to depression.
Hypothesis A hypothesis is a testable prediction, often prompted by a theory, to enable us to accept, reject or revise the theory. People with low self-esteem are apt to feel more depressed.
Research Observations Research would require us to administer tests of self-esteem and depression. Individuals who score low on a self-esteem test and high on a depression test would confirm our hypothesis.
Descriptive Research Case Study A technique in which one person is studied in depth to reveal underlying behavioral principles. Susan Kuklin/ Photo Researchers Is language uniquely human?
+ can collect tons of information + suggests hypothesis for further studies + can ask questions - very time consuming - any subject may be atypical - results may be inconclusive
Survey A technique for ascertaining the self-reported attitudes, opinions or behaviors of people usually done by questioning a representative, random sample of people. http://www.lynnefeatherstone.org
+ tons of data • + cheap, easy, fast • + anonymous • - uninterested subjects • - unclear questions • - subject bias • - can’t gather further information from subjects
Survey Wording Effects Wording can change the results of a survey. Q: Should cigarette ads and pornography be allowed on television? (not allowed vs. forbid)
Survey Random Sampling If each member of a population has an equal chance of inclusion into a sample, it is called a random sample (unbiased). If the survey sample is biased, its results are not valid. The fastest way to know about the marble color ratio is to blindly transfer a few into a smaller jar and count them.
Figure 2.16 The relationship between the population and the sample
Naturalistic Observation Observing and recording the behavior of animals in the wild and recording self-seating patterns in a multiracial school lunch room constitute naturalistic observation. Courtesy of Gilda Morelli
+ subjects will act as they usually do • + done on your own time • + can further investigate if necessary • - cannot interact with subjects • - time consuming • - can’t always generalize results
Descriptive Research Summary Case studies, surveys, and naturalistic observation describe behaviors. What are the limitations of descriptive research?
Indicates direction of relationship (positive or negative) Correlation coefficient Indicates strength of relationship (0.00 to 1.00) Correlational Research helps us find RELATIONSHIPS! When one trait or behavior accompanies another, we say the two correlate. Correlation Coefficient is a statistical measure of the relationship between two variables. r = + 0.37
Two Basic Kinds of Correlations: • Positive: the variables change in the same direction, like height and weight. • Negative : the variables change in opposite directions, like: as class absences increase, grades tend to decrease. Positive and Negative
Scatterplots Perfect positive correlation (+1.00) Scatterplotis a graph comprised of points that are generated by values of two variables. The slope of the points depicts the direction, while the amount of scatter depicts the strength of the relationship.
Scatterplots Perfect negative correlation (-1.00) No relationship (0.00) The Scatterplot on the left shows a negative correlation, while the one on the right shows no relationship between the two variables.
Data Data showing height and temperament in people.
Scatterplot The Scatterplot below shows the relationship between height and temperament in people. There is a moderate positive correlation of +0.63.
Correlation and Causation Correlation does not mean causation! or
Critical Thinking 4: Correlation Does Not Prove Causation Confusing “What” with “Why”
Correlations • A correlation occurs when: • two or more variables are in a relationship where one variable gives us information about the other(s). • Correlations: • allow us to predict relationships based on statistical probability. • give us an idea of both the direction (positive or negative) and degree to which two or more variables are related.
EXAMPLES • Mild positive corr: violence on TV and aggressive behavior • Negative corr: self-esteem and depression • Positive corr: authoritative parenting style and socially competent children • Positive corr: use of heroin and previous use of marijuana
Correlations • It is possible (but not common) for a correlated relationship also to be a causal relationship. • Example: Unprotected sexual intercourse is both correlated with and causal of pregnancy • But, correlations do not prove causation. • Knowing what occurs does not explain why it occurs. • We can predict likely out outcomes, but not causes.
Correlations • The Contiguity–Causation Error • This occurs when we assume that because two events happen next to each other in time, that they are in a cause-and-effect relationship. • Example: • Your mother calls, your spouse leaves the room. Therefore, your spouse left the room because your mother called. (While this may be true, there are numerous reasons why someone would leave a room at a particular moment, other than your mother calling.)
The Experimental Method:Discovering the Causesof Behavior Experiment: A controlled situation in which the researcher manipulates one variable to discover its effect on another variable, while holding all other conditions constant. Key Concepts
The Experimental Method:Discovering the Causesof Behavior Independent Variable: The variable that the researcher “manipulates”. “Manipulates” basically means that we assign different levels of the variable to different groups. For example: Suppose the independent variable is the amount of time students have to take a test. We can give one class 40 minutes and another 60 minutes. These are the levels of the time variable. Key Concepts
Confounding Variables… Any variable not controlled for that could change the results of the experiment…
The Experimental Method:Discovering the Causesof Behavior Dependent Variable: This is an aspect of the participant’s behavior that the researcher records to see if it will be influenced by the independent variable. For example: In the test-taking situation, we could record how many questions each student got right. Number of correct answers would be the dependent variable. In everyday terms: Independent Variable = “Cause” Dependent Variable = “Effect” Key Concepts
The Experimental Method:Discovering the Causesof Behavior So if the students who get 60 minutes to take the test do better than those who get 40 minutes, we can say it was the time factor that caused this difference in performance, assuming… there were no other differences between the classes. Everything else must be “HELD CONSTANT”. Key Concepts
The Experimental Method:Discovering the Causesof Behavior Experimental Group: This is a group that is exposed to the independent variable. Control Group: This is a group that is not exposed to the independent variable. Additional Terms Control Experimental1 Experimental2 Levels: 0 1 2
Experimental vs. Control Groups The effects of violent video game play on reaction time…IV? DV? Which group plays the violent game???
Evaluating Therapies Double-blind Procedure In evaluating drug therapies, patients and experimenter’s assistants should remain unaware of which patients had the real treatment and which patients had the placebo treatment.
Evaluating Therapies Random Assignment Assigning participants to experimental (breast-fed) and control (formula-fed) conditions by random assignment minimizes pre-existing differences between the two groups.
Ethics in Psychological Research:Do the Ends Justify the Means? • The question of deception • The question of animal research • Controversy among psychologists and the public • Ethical standards for research: the American Psychological Association • Ensures both human and animal subjects are treated with dignity
Comparison of Research Types… Below is a comparison of different research methods.
Statistical Reasoning in Everyday Life Doubt big, round, undocumented numbers as they can be misleading and before long, become public misinformation. Apply simple statistical reasoning in everyday life to think smarter!
Experiment Terminology • Operational definitions are used to clarify precisely what is meant by each variable • Participants or subjects are the organisms whose behavior is systematically observed in a study • Data collection techniques allow for empirical observation and measurement • Statistics are used to analyze data and decide whether hypotheses were supported
Describing Data A meaningful description of data is important in research. Misrepresentation may lead to incorrect conclusions.
Measures of Central Tendency Mode:The most frequently occurring score in a distribution. Mean:The arithmetic average of scores in a distribution obtained by adding the scores and then dividing by the number of scores that were added together. Median:The middle score in a rank-ordered distribution.