Download
1 / 30
300 likes | 418 Views
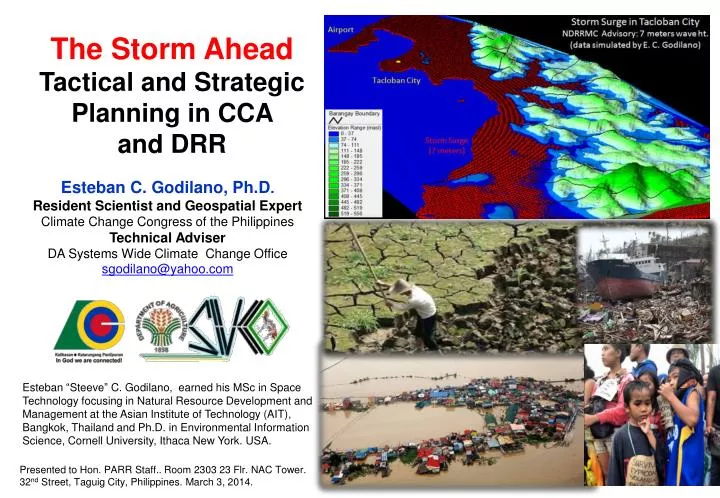
The Storm Ahead Tactical and Strategic Planning in CCA and DRR. Esteban C. Godilano , Ph.D . Resident Scientist and Geospatial Expert Climate Change Congress of the Philippines Technical Adviser DA Systems Wide Climate Change Office sgodilano@yahoo.com.

E N D
The Storm Ahead Tactical and Strategic Planning in CCA and DRR Esteban C. Godilano, Ph.D. Resident Scientist and Geospatial Expert Climate Change Congress of the Philippines Technical Adviser DA Systems Wide Climate Change Office sgodilano@yahoo.com Esteban “Steeve” C. Godilano, earned his MSc in Space Technology focusing in Natural Resource Development and Management at the Asian Institute of Technology (AIT), Bangkok, Thailand and Ph.D. in Environmental Information Science, Cornell University, Ithaca New York. USA. Presented to Hon. PARR Staff.. Room 2303 23 Flr. NAC Tower. 32nd Street, Taguig City, Philippines. March 3, 2014.
Presentation Outline • The Challenge • Understanding Storm Surge • Connecting the dots: Yolanda spatial impacts • Moving forward • Opportunities
The Earth is Warming Global annual average temperature and CO2 concentration continue to climb. 1880-2007 Modelling study concluded that by the time atmospheric concentrations of CO2 reach 560 ppm “all coral reefs will cease to grow and start to dissolve” (Source: Silverman et al. 2009). 1997 Kyoto Protocol COP 19
WARMING will persist for centuries carbon emission • Zero CO2 emissions lead to near constant surface temperature. • A large fraction of climate change persists for many centuries. • About 15-40% of the emitted CO2remains in the atmosphere for 1,000 years concentration increase temperature increase
Countries by CO2 (MT) emissions via the burning of fossil fuels (blue the highest) USA CHINA Lao 0.01% Vt 0.42% Ph 0.28% Ind 1.35% Mn 0.04% Cam 0.02% Th 0.95% China and USA emit 42% of the world total Of 210 countries, the Philippines ranked 47th. The top 10 countries in the world emit 67.2% of the world total. http://www.guardian.co.uk/news/datablog/2011
World Risk Index Report 2011 Source: UNU IEHS (Sept 26,2011) http://ihrrblog.org/2011/09/26/2011-un-world-risk-index/ 9th in 2009 6th in 2010 • In terms of disaster the Philippines is No.1 • In terms of Sea Level Rise (SLR) the Philippines is No.5 affecting 14 M people
Typhoons > 1 B PhP annualtotal damage in agriculture For the last 20 years NO destructive typhoons passes through Mindanao
Exporter of Typhoons Tracks of Tropical Cyclones in the Western North Pacific Period from 1948 to 2010. Source: Japan Meteorological Agency: http://www.jma.go.jp/).
Understanding Storm Surge archives.starbulletin.com Storm surge is the amount of water, combined with the effect of normal tides, which is pushed towards the shore during a storm. • Factors that determine storm surge heights: • Wind speed and intensity, • Size of the radius of maximum winds, • Radius of the wind fields, • Angle of the track relative to the coastline, • Bathymetry of the water offshore, • Shape and characteristics of coastal features such as bays and estuaries. • (http://www.nhc.noaa.gov/surge/) The presence of mangrove, coral reefs and rocky shores help dissipate the wave energy.
Storm surge map and data of selected Municipalities in Leyte 1998 vs 2007 1.5 km 12.5 km
NDRRMC ADVISORY ON TYPHOON YOLANDA 07 Nov 5:00 AM Signal #2: (215-250 kp/h) “Monitor the situation and undertake precautionarymeasures in your area of responsibility 07 Nov 11:00 AM: Signal # 3 08 Nov. 5:00 AM: Signal # 4 Signal #3 and #4(225-275 kp/h) “Those living in coastal areas under signal #4 #3, and #2 area alerted against storm surge which may reach up to 7-meter wave height.” Advisories and press releases are NOT ENOUGH www.ndrrmc.gov.ph
It should be accompanied by MAPS and DATA for LGUs to conduct tactical and strategicplans for informed decision making. Maps for tactical plans THREE MAPS Affected Population (Tacloban City) Data for strategic plans Total population 221,321 (NSO 2010)
Storm Surge (SS) = fn: ws + wd + el + sl Storm Surge: Wind Speed (ws) + Wind Direction (wd) + Elevation (e) + Slope (s) = 7 km
Storm Surge in Tacloban City Area affected (ha) Barangay affected Simulated output based on NDRRMC advisory
Affected Barangay 7- Meters Storm Surge (Simulated from NDRRMC 2013)
Enhancing output in 3D view using Google Earth (Simulated data from NDRRMC 2013) Astrodome Tacloban City Airport
NEDA PRIORITY ONE PROVINCES AND MUNICIPALITIES (50 km Radius)
NEDA Priority Areas There are 171 municipalities in 14 provinces categorized by as priority 1 for relief and rehabilitation that are within the 50 km radius of the Typhoon Yolanda track. Observations • There are municipalities outside the 50 km radius which are included in the list. • There are only 155 municipalities within the 50 km radius (shaded green). Recommendation The basis for the declaration of Priority 1 Municipalities by NEDA should be clarified for more accurate assumptions for better planning/and informed decision making.
LEYTE PROVINCE LAND USE (2009) 0 SOUTHERN LEYTE PROVINCE LAND USE (2009)
CROP SUITABILITY BY HECTARES Leyte and Southern Leyte
SUTABILITY FOR AGRICULTURE LAND USE 2009
Climate Change Impacts to Agriculture and Non Agriculture:Tacloban City
Opportunities 1. Multi-hazard risk management approaches provide opportunities to reduce complex and compound hazards. 2. Integration of local knowledge with additional scientific and technical knowledge can improve disaster risk reduction and climate change adaptation. 3 Appropriate and timely risk communication is critical for effective adaptation and disaster risk management
Multi-hazard Risk Management Integrated Map One Map One Data Thematic Maps Geospatial Technology • Slow Onset • Rainfall • Temperature • Extreme Events • Landslides • Erosion • Flooding • Drought • Storm Surge • Wind Speed • Disaster • Geohazard • Liquefaction • Ground tremor • Volcanic eruption • Tsunami LGUs One Map Manny Data CLUP WHERE WE ARE WHAT WE WANT TO ACHIEVE
Multi-hazard Risk Management Map Tacloban City (2014)
Integrated Watershed Management Plan We need to integrate ECG DRR Government Initiatives What is needed is for the LGUs “to harvest low hanging fruits” that are within its reach. We need to integrate other government initiatives in the CLUP and strictly implement our environmental laws which according to the UN are the best in the world. CCAMP DRR • Climate Change • Adaptation and • Mitigation Plan DRRMP DRR FLUP • Disaster Risk • Reduction and Management Plan SAFDZ • Forest Land Use Plan CRMP • Strategic Agricultural • and Fishery Dev. Zone CLUP • Coastal Resource • Management Plan We need to implement Comprehensive Land Use Plan Environmental Laws
Tacloban City Typhoon Yolanda A business as usual approach will be an indictment of our generation that our children will never forgive. “Problems cannot be solved at the same level of awareness that created them.” - Albert Einstein The Stake are VERY High Thank You