Download
1 / 23
230 likes | 315 Views
RNA profiles. metabolic changes. ModeScore A method to infer changed activity of metabolic functions from transcript profiles. Andreas Hoppe, Charité University Medicine Berlin Computational Systems Biochemistry Group. Outline. Introduction ModeScore method Application example

E N D
RNA profiles metabolic changes ModeScore A method to infer changed activity of metabolic functions from transcript profiles Andreas Hoppe, Charité University Medicine Berlin Computational Systems Biochemistry Group
Outline • Introduction • ModeScore method • Application example • Implementation/Summary Introduction — ModeScore — Application —Summary
Outline • Introduction • ModeScore method • Application example • Implementation/Summary Introduction — ModeScore — Application —Summary
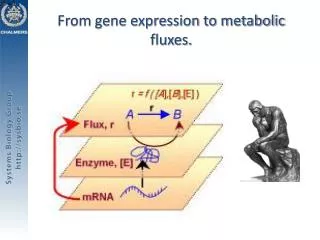
Functional layers of cells Introduction — ModeScore — Application —Summary
Functional layers of cells Many intermediate levels • many modifying factors • quantitative predictivity low • knowledge must be integrated Gygi et al., 1999, Mol. Cell Biol. Blazier & Papin. 2012, Front Physiol. Hoppe, 2012, Metabolites 2. Why transcripts then? • large information gain per material & money • easy measurement (compared with metabolites, fluxes, proteins) • multitude of available datasets Introduction — ModeScore — Application —Summary
Objective of method Given: measured transcript abundances • Select metabolic function with the most remarkable pattern • Select the genes that • are related to this metabolic function • significantly change • have sufficiently high expression • show remarkable pattern of change Introduction — ModeScore — Application —Summary
Outline • Introduction • ModeScore method • Application example • Implementation/Summary Introduction — ModeScore — Application —Summary
FASIMU HepatoNet1 Prediction idea We know • the way enzymes cooperatively work • the cell’s metabolic functions reference flux distributions Metabolic function definition Reference flux mode HepatoNet1 … , Gille et al., 2010, Mol Syst Biol FASIMU … Hoppe et al., 2011, BMC Bioinf Introduction — ModeScore — Application —Summary
1 mi/λ Prediction idea Assumptions: • Gene up flux value up (& vice versa) • Normal distribution • Probability maximum: flux/scaling factor Pattern match Abundance change — Flux mode Introduction — ModeScore — Application —Summary
1 mi/λ Mode set scoring Introduction — ModeScore — Application —Summary
ModeScore amplitude (1/) • Measures strength of regulation for the function • Compatible to log2 fold change • Cluster point (not average) of gene changes Contribution scores (scorei) • Measures how good a gene change represents the function’s amplitude Introduction — ModeScore — Application —Summary
ModeScore analysis • Ranking of functions by amplitude for each relative profile • Collect similar functions • Select remarkable functions • For each function, rank the genes by their contribution • Select set of genes representing the remarkable pattern Introduction — ModeScore — Application —Summary
Outline • Introduction • ModeScore method • Application example • Implementation/Summary Introduction — ModeScore — Application —Summary
Hepatocyte culture/TGF treatment Dooley, 2008, Gastroenterology Godoy, 2009, Hepatology Cuiclan, 2010, J Hepatology A B 1 2 3 C Extraction 1h 6h 24h Culture Treatment 1h 6h 24h Ilkavets, Dooley Introduction — ModeScore — Application —Summary
Ranking of functions, example TGF treated at 24h vs. control 24h Introduction — ModeScore — Application —Summary
Selection of genes, example Introduction — ModeScore — Application —Summary
Phenylalanine/Tyrosine degradation Introduction — ModeScore — Application —Summary
Ethanol degradation Introduction — ModeScore — Application —Summary
Outline • Introduction • ModeScore method • Application example • Implementation/Summary Introduction — ModeScore — Application —Summary
Implementation • Reference flux mode computation • www.bioinformatics.org/fasimu • ModeScore computation • data handling: bash/gawk • scaling factor optimization: octave • table generation: LaTeX • bargraphs, t-test: R Introduction — ModeScore — Application —Summary
RNA profiles metabolic changes Summary Introduction — ModeScore — Application —Summary
Summary Semi-automatic process • refinement of network, functions, annotations • scoring/ranking • manual selection Selection of changed genes Testable hypothesis Introduction — ModeScore — Application —Summary
Hermann-Georg Holzhütter, Berlin Matthias König, Berlin Iryna Ilkavets Mannheim Patricio Godoy, Dortmund Sebastian Vlaic, Jena Acknowledgements