Download
1 / 28
280 likes | 446 Views
TF Infer. A Tool for Probabilistic Inference of Transcription Factor Activities H.M. Shahzad Asif Machine Learning Group Department of Computer Science University of Sheffield. Scope. Introduction Software Features Inputs and Outputs Software Interfaces

E N D
TFInfer A Tool for Probabilistic Inference of Transcription Factor Activities H.M. Shahzad Asif Machine Learning Group Department of Computer Science University of Sheffield
Scope • Introduction • Software Features • Inputs and Outputs • Software Interfaces • Software Requirements and Availability • Acknowledgements • References
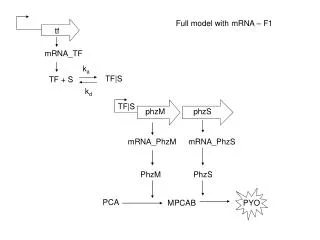
Introduction • A novel standalone software for inference of transcription factor activities (TFAs). • Following probabilistic state space model provides the basis: • “y(n)” is expression level of gene “n” at time instant “t” and the only observed variable. • “Xnm” contains binary value corresponding to link between gene “n” and transcription factor “m”. • “bnm” encodes the regulatory strength between gene “n” and transcription factor “m”.
Introduction • Latent or Hidden variable cm(t) is used to estimate mth TFA at time instant "t”. • Efficient Variational Bayesian EM algorithm is used to obtain the posteriors over model parameters. • Model exploits the natural sparsity of the regulatory network by using connectivity information. • Feasible for genome-wide applications. • Probabilistic approach helps to associate confidence intervals with the results.
Software Features • Genome-wide Inference. • Freeware. • Open-source. • Supported data types: • Times-series data • Time-independent data • Replicates • Genome connectivity included for: • Yeast • E. coli
Software Features • Computationally efficient. • User friendly. No programming expertise required. • Probabilistic Modelling for TFAs. • Coded in C using Matlab C Math library. • GUI is developed using C#. • Core part can be used as a plug-in (a .dll file). • Help file and documentation of the code available.
Input and Output Files • Inputs • Standard format is CSV (Comma separated file). • Input files contain logged gene expression data. First column for gene annotations and a (optional) header row. • Connectivity data is included with the software for Yeast and E.coli. • For yeast, the connectivity file contains common names of genes. • For E.coli, the connectivity file contains b numbers. • User can supply own connectivity file. • Using data selection interface, required transcription factors can be selected.
Input and Output Files (cntd.) • Output • TFAs in two formats: • Graphical representation (error bars) for every transcription factor selected. • A CSV file for TFAs. • Graphs can be saved in different formats. • CSV file can be exported containing TFAs. • As the model is probabilistic, all results have confidence intervals.
Software Interface • Three main interfaces: • Data input and Initial Configuration: • Gene expression data. • Genome connectivity. • Time-series, time-independent, replicates. • Data Selection: • Transcription factor selection. • Result: • Graph for each transcription factor. • A CSV file containing relative concentration of all transcription factors selected.
TFInfer Main Interface Description Using this option, data file(s) is supplied containing gene expression data. For replicates, multiple files can be used. Maximum number of replicates is 5.
TFInfer Main Interface Description If data file(s) contains a header row, then this option must be selected before selecting data file.
TFInfer Main Interface Description Specify whether the data is - Time-series or - Time-independent
TFInfer Main Interface Description In case of replicates, this option must be selected. If selected, number of replicates are shown on the right.
TFInfer Main Interface Description Connectivity file is supplied using this. Two connectivity files are included; for yeast and E.coli.
TFInfer Main Interface Description Specify whether to use the files supplied with the software or user-supplied.
TFInfer Main Interface Description Reset the state of the software.
TFInfer Main Interface Description Start the process.
TFInfer Main Interface Description When model is built, results can be seen using this option.
TFInfer Main Interface Description For every data file, TFInfer shows the summary of the data. For connectivity file, this information is also shown followed by the a window containing a list of transcription factors.
TFInfer Data Selection Interface Description User can select any number of transcription factors here.
TFInfer Results Window Description This option is for saving the result as a plot.
TFInfer Results Window Description This option is for saving the result as CSV file for all the transcription factors in the list.
Software Requirements and Availability • Microsoft .Net framework version 2 is required. Download link is available on TFInfer page. • Software installer and other related material available on TFInfer home: • http://www.dcs.shef.ac.uk/ml/tfInfer.html
Acknowledgements • Software is based on the model proposed in bioinformatics paper[1]. • Matlab Math C library is used for core part implementation of the model. • Thanks to Dr Matthew Rolfe for providing connectivity information and for useful discussions. • Thanks to Dr. Guido Sanguinetti for all the support. • Thanks to UoS for DoR Devolved funding.
References [1]G. Sanguinetti, N. Lawrence, and M. Rattray. Probabilistic inference of transcription factor concentrations and gene-specific regulatory activities. Bioinformatics, 22(22):2775, 2006. [2]C. Harbison, D. Gordon, T. Lee, N. Rinaldi, K. Macisaac, T. Danford, N. Hannett, J. Tagne, D. Reynolds, J. Yoo,et al. Transcriptional regulatory code of a eukaryotic genome. Nature, 431:99–104, 2004. [3]T. I. Lee, N. J. Rinaldi, F. Robert, D. T. Odom, Z. Bar-Joseph, G. K. Gerber, N. M. Hannett, C. T. Harbison,C. M. Thompson, I. Simon, J. Zeitlinger, E. G. Jennings, H. L. Murray, D. B. Gordon, B. Ren, J. J. Wyrick,J.-B. Tagne, T. L. Volkert, E. Fraenkel, D. K. Gifford, and R. A. Young. Transcriptional Regulatory Networks in Saccharomyces cerevisiae. Science, 298(5594):799–804, 2002. [4]P. T. Spellman, G. Sherlock, M. Q. Zhang, V. R. Iyer, K. Anders, M. B. Eisen, P. O. Brown, D. Botstein, and B. Futcher. Comprehensive Identification of Cell Cycle-regulated Genes of the Yeast Saccharomyces cerevisiae by Microarray Hybridization. Mol. Biol. Cell, 9(12):3273–3297, 1998. [5]http://www.zedgraph.org/ [6]Matlab C Math library. [7]http://www.ecocyc.com/
Contact Shahzad Asif Shahzad.asif@sheffield.ac.uk Machine Learning Group Department of Computer Science 211 Portobello Regent Court Sheffield S1 4DP