Download

1 / 32
320 likes | 490 Views
Development of RVU Scales at SA Pathology. Adrian Burchall. PPM Implementation. SA Pathology began full implementation of PPM in March 2009 Test cost data was first produced in April 2010 ( Cytopathology ) Now setting up costing for the 2009/10 financial year

E N D
Development of RVU Scales at SA Pathology Adrian Burchall
PPM Implementation • SA Pathology began full implementation of PPM in March 2009 • Test cost data was first produced in April 2010 (Cytopathology) • Now setting up costing for the 2009/10 financial year • Now also planning for the 2010/11 financial year (complicated by the move to an ORACLE based finance system across SA Health
SA Pathology • SA Pathology came into existence in early 2008 with the amalgamation of all state-based, publicly funded medical laboratories • SA Pathology is now the state-wide government pathology service, with sites throughout metropolitan Adelaide and regional South Australia • $250m budget • Approximately 2,000 employees • Increasing amount of private work
Pathology Services • Chemical Pathology • Cytopathology / Surgical Pathology • Haematology • Immunology • Microbiology and Infectious Diseases • Genetics and Molecular Pathology • as well as having a large automated laboratory (automated chemistry, haematology, and immunoassay)
Costing Project • Four main aspects to the costing project • System configuration • Data collection and quality assurance • Data loading • RVU determination • Cost determination using PPM • Many tasks undertaken jointly by PHS and SA Pathology staff
Data Collection Step 1 • The first step was to determine the scope of the costing exercise, egShould we cost all tests at all sites? • The answer was no─ because two hospitals (FMC and WCH) had only recently become part of SA Pathology and their laboratory information systems were not fully integrated with ours • A retrospective cost study for 2008/09 was used to determine the RVUs • We initially sought to determine the cost of all tests in all IMVS laboratories (ie excl FMC & WCH)
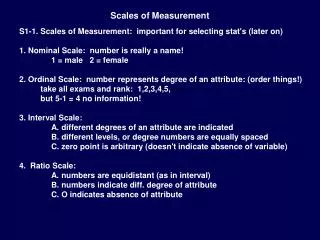
Data Collection Step 2 The second major decision was to determine an appropriate test classification system for costing purposes, and which also had clinical credibility. For example, should we classify tests at the: • Panel level, egCREATININE CLEARANCE • MBS level, eg66500 - 1 Chemistry • Panel and Item levelegPOCT CHEM 8 - eSeU eV eWeXeYeZeeefeg f0where eS = SODIUM, eU = POTASSIUM
Major Cost Categories The major cost categories for the capture of data were: • Labour • CPRReagents (automated lab only) • Consumables ─ Stock Issues • Consumables ─ Non-Stock Requisitions • Equipment.
Levels of Combination For our data capture, the following combinations were used for each major cost category: • Labour timingsunique combination of Panel and MBS • CPRReagentsunique combination of Panel, MBS and Item • Consumablesunique combination of Panel, MBS and Item • Equipment (for allocation of Depn)unique combination of Panel and MBS.
Combinations — Labour Labour timings were captured as a unique combination of Panel and MBS code
Combinations – CPRReagents & Consumables CPRReagents and Consumables usage were captured as unique combinations of Panel, MBS, and Item code
Equipment Equipment use timings were captured as a unique combination of Panel and MBS code
Unit Cost Determination In parallel with the data capture we determined the unit price of each of the cost categories. For example: • LabourThe unit average cost for a Technical Officer L1–2 = $31.80/hr or $0.53/min • ConsumablesThe unit cost of ETHANOL ABSOLUTE AR 2.5LTR = $0.0168/ml • Equipment depreciationThe unit depreciation charge for the CENTRIFUGE: MEGAFUGE-HERAEUS: Serial No: 182280 = $0.64/min
SA Pathology Costing Philosophy Why does SA Pathology cost its tests at a detailed level? • Clinical credibility – at the very beginning of the project we had senior scientists asking, “how much does it cost to do a calcium, potassium, etc” • It is easier to get behind what drives costs, to more accurately determine changes in costs resulting from changes in activity.
How SA Pathology Uses the Results The results are primarily used to compare costs with revenues (mainly by MBS reimbursement rate)
Cost Profile Editor SA Pathology plans to use the Cost Profile Editor to enable a ready updating of cost profiles
Thank You Adrian Burchall