Download
1 / 22
220 likes | 339 Views
Wind velocity & Seismic activity – a couple? Summer 2012 RET @ LHO. Mark Buchli Liberty High School, Issaquah, WA Wind Map. Educational Aspect. Compiled a revised punch list for Bluestone 2.0 ( To date, 2 of 6 items have been addressed )

E N D
Wind velocity & Seismic activity – a couple? Summer 2012 RET @ LHO Mark Buchli Liberty High School, Issaquah, WA Wind Map
Educational Aspect • Compiled a revised punch list for Bluestone 2.0 (To date, 2 of 6 items have been addressed ) • Updated Using LIGO’s e-Lab as a tool for Understanding Science – Advanced Version (the 1200 data points dilemma 1 month = 36 min, 1 week = 8 min, etc)
2011 Research Question: Which arm @ LHO is seismically more vulnerable to wind effects? Fraction of time (hours) Wmph >25 mph: LLO = .009 LHO = .104* Therefore LHO has 12x as many “windy” days * R. Schofield, 2002
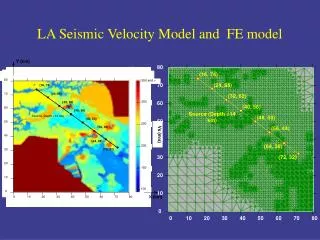
Targets of interest – EY & EX stations EX EY • Note topography (flat vs. dip), face profiles & location of weather station • SW (225 - 250) on EY = direct wall encounter
Wind Effects – a simplified view • Uniform lateral pressure lateral force • Lateral force acceleration • Acceleration seismic foot print?
Wind Effects – a simplified view Using: KE = ½ mv2 Mass transfer rate α velocity E seismic α v2 E wind α v3 v1 v2
2011 continued:slope comparisons – EY is target of interest for future research
Wmph & seisZ samples – 2012 project EY 1440 minutes /day
Wmph Reliability Check # 21 EY Separation = 11.6 miles
Testing the Wmph – using a DFT/FFT An automotive application of frequency spectrum (Brüel & Kjær "Structural Testing") Changing a complex, contaminated signal from a time domain to a frequency domain Extracting an estimate of frequency components
Are they a couple? Average slope (all bins) = 1.53 +/- .22 Average slope (all bins) = 2.19 +/- .45
Questions for future work (2013 ?) • Why the uncoupling when analysis becomes more granular? • Could multi-year data be merged to produce a larger sample size? • How does EX, MX, & MY compare to EY ? • Can the β term (y –intercept) be used to test the model? If so, how? • Is there a different/better mathematical model?
Acknowledgements • Fred Raab • Dale Ingram • Robert Scofield • Tran Phung • Jonathan Hanks • Support Staff @ Caltech • NSF