Download
1 / 12
120 likes | 200 Views
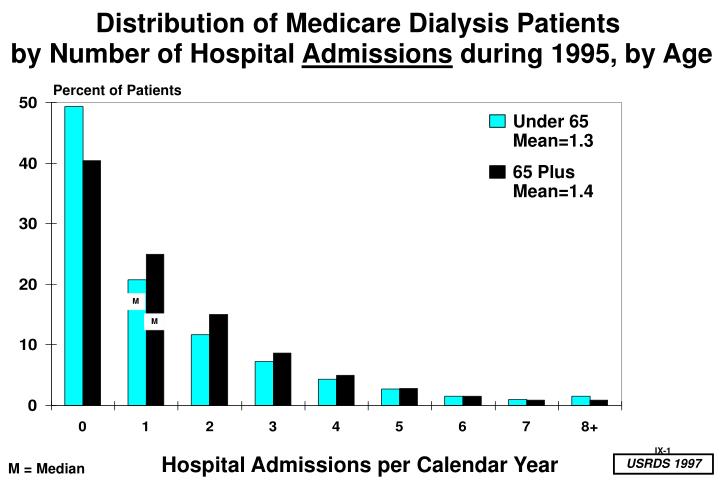
Distribution of Medicare Dialysis Patients by Number of Hospital Admissions during 1995, by Age. Percent of Patients. Under 65 Mean=1.3. 65 Plus Mean=1.4. M. M. Hospital Admissions per Calendar Year. M = Median. Under 65 Mean=9.6. 65 Plus Mean=11.4.

E N D
Distribution of Medicare Dialysis Patients by Number of Hospital Admissions during 1995, by Age Percent of Patients Under 65 Mean=1.3 65 Plus Mean=1.4 M M Hospital Admissions per Calendar Year M = Median
Under 65 Mean=9.6 65 Plus Mean=11.4 Distribution of Medicare Dialysis Patients by Number of Hospital Days during 1995 by Age Percent of Patients Median: 3 Days Median: 1 Day M M Hospital Days per Calendar Year
Hospital Admissions per Year at Risk for Medicare Dialysis Patients, by Modality and Age, 1993-1995 All Dialysis Hemo- dialysis CAPD/ CCPD All ESRD All Dialysis Hemo- dialysis CAPD/ CCPD All ESRD All Dialysis Hemo- dialysis CAPD/ CCPD All ESRD All Dialysis Hemo- dialysis CAPD/ CCPD All ESRD 0-19 Years 20-44 Years Admissions 1.7 1.8 1.7 1.7 1.7 1.6 0.9 1.1 45-64 Years 65+ Years 2.0 2.0 2.0 1.9 1.7 1.7 1.8 1.4
M F White Black Asian Native American White Black Asian Native American White Black Asian Native American White Black Asian Native American Hospital Admissions per Year at Risk for Medicare Dialysis Patients by Race, Sex and Age, 1993-1995 Admissions 0-19 Years 20-44 Years All 45-64 Years 65+ Years
Standardized* First Hospital Admission (Medicare) and Mortality Ratios by Census Region, 1993-1995 Pacific Mountain West North Central West South Central East North Central East South Central North- east Middle Atlantic South Atlantic Pacific Mountain West North Central West South Central East North Central East South Central North- east Middle Atlantic South Atlantic SHR SMR 90% 75% 50% 25% 10% * For Age, Race, Sex, ESRD Cause orDiagnosis
MI DE MD The Nine Census Regions,Grouped by SHR*, Medicare, 1993-1995 AK West North Central Mountain East North Central Northeast M=0.88 NH M=0.93 M=1.15 ME VT Middle Atlantic WA VT M=1.06 MT ND MA MN M=1.13 OR RI ID WI SD CT NY WY PA IA NE NV OH UT IN CO CA NJ IL KS MO HI WV KY NM AZ VA TN NC Pacific OK AR SC M=0.92 AL MS South Atlantic GA West South Central TX LA East South Central M=1.08 FL M=1.13 M = Median M=1.14 *Hospitalization Rate, Standardized by Age, Race, Sex, ESRD Cause
Under 20 20-50 Over 50 Expected Number of First Admissions in Three Year Period Distribution of SHR for First Admissions of Medicare Dialysis Patients by Dialysis Unit Size, 1993-1995 SHR 2.41 1.67 1.63 1.39 1. 35 90% 75% 1.22 1.10 1.08 1.04 50% 0.87 0.88 25% 10% 0.75 0.69 0.62 Number of Dialysis Units: 529 481 1814 Median Number Patients Per Unit Per Year: 22 71 148
Number of Dialysis Units: 236 1437 599 Distribution of SHR for First Admission (Medicare) Ratios of Dialysis Units by Type, 1993-1995 1. 62 90% 1.47 1.40 1.33 1.23 75% 1.17 1.08 1.02 50% 1.0 .99 .81 .88 .64 25% .81 .66 .70 10% Free Standing, Not-For-Profit Free Standing, For-Profit Hospital
National SHRs of First Admissions by Year, Medicare 1991-1995 + - + - + - + - SHR* 0.008 0.007 0.007 0.006 1991 1992 1993 1994 1995 SHR* First Admissions *Standarized to 1995 Age, Sex, Race, Diagnosis Distribution SHR with 95 percent confidence interval
Mean and Median Number of Hospital Admissions and Days During Year, Medicare 1991-1995
Weighted Average SMRs and SHRs* by Medicare Dialysis Unit Type, 1993-1995 Excludes Units with <20 Expected First Admissions in Period * Single rate calculated for all units of each type
Correlations* of SMRs andSHRs Across Years, by Dialysis Unit, 1991-1995 Excludes Units with <5 Expected First Admissions per Year Year SHR SMR * Spearman Rank Correlation n = 1814 to 2464