Download
1 / 39
390 likes | 553 Views
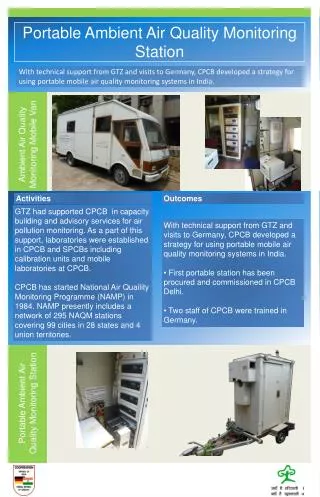
California Ambient Dioxin Air Monitoring Program (CADAMP) October 2004. Air Resources Board. California Environmental Protection Agency. Background. Program initiated in 2000. Initial funding for two years of ambient monitoring (CADAMP), stationary source testing, and mobile source testing

E N D
California Ambient Dioxin Air Monitoring Program (CADAMP)October 2004 Air Resources Board California Environmental Protection Agency
Background • Program initiated in 2000. Initial funding for two years of ambient monitoring (CADAMP), stationary source testing, and mobile source testing • Monitoring for dioxins/furans, dioxin-like PCBs (collectively referred to as dioxins), and PBDEs • Data will be used to help understand ambient levels and prioritize risk management strategies
Background cont. • Most monitoring began December 2001 • 10 sites currently in operation • Additional funding allowed for a third year of monitoring • CADAMP, as currently configured, expected to continue through 2004
Health Effects • Dioxin listed as an SB 25 (Children’s Health) top 5 chemical • Infants and children especially susceptible to illness from dioxin exposure • Highly carcinogenic • Immune and developmental system toxicity • Liver toxicity • Highly persistent and bioaccumulative
CADAMP Site Locations • CADAMP locations chosen based on several factors: • Proximity to suspected dioxin sources • Elevated concentrations of criteria, toxic, and related pollutants • Monitoring sited with SB 25 sites (where possible) and at existing monitoring sites
CADAMP Site Locations • Bay Area Sites (began December 2001) • Crockett (SB 25 site) • Livermore • San Jose • Richmond • Oakland/Fruitvale (SB 25 site) ARB partnering with Bay Area AQMD
CADAMP Site Locations • South Coast Sites (began December 2001) • Boyle Heights (SB 25 site) • Reseda • Rubidoux • Wilmington (SB 25 Site) ARB partnering with South Coast AQMD • Sacramento (began January 2003) • ARB operated • 13th and T Streets
BAAQMD Additional Site • San Francisco (Arkansas Street) • NDAMN schedule • monitoring began January 2002 • CADAMP schedule • monitoring began January 2003
U.S. EPA Site Locations • U.S. EPA has established a national dioxin air monitoring network (NDAMN) to estimate rural concentrations of dioxins/furans and PCBs in ambient air throughout the U.S. • NDAMN sites in California located in: - Fort Cronkhite (Bay Area) • Began in November 2000 - Rancho Seco (Central Valley) • Began in April 2001
Monitored Compounds • 17 dioxin/furans • 14 dioxin-like PCBs • 44 PBDEs • Analysis began May 2003 • 6 sites 2,3,7,8 -TCDD 2,3,7,8-TCDF 3,3’,4,4’-TeCB 2,2’,4,4’,6-Pentabromodiphenyl Ether
Toxicity Equivalence Factors (TEFs) • Concentrations for dioxins expressed as toxicity equivalence (TEQ). • Use 1997 WHO TEFs • Numerical factors that express toxicity of each dioxin, furan or PCB relative to the toxicity of 2,3,7,8-TCDD • Recently adopted by OEHHA and replace the I-TEFs
Ambient Monitoring/Results • Monitoring methods overview • 2002 CADAMP results • 2003 CADAMP results • CADAMP data vs. other dioxin data
Sampling • Based on U.S. EPA Method TO-9A • normally used for 24-hour samples • indicates up to 7-day samples may be collected • CADAMP uses extended sampling periods • 20 to 24 days total sample collected • Long duration/Large sample volume • provides low detection limits • minimizes the non-detects • provides comprehensive temporal coverage (representativeness) • Result is the integrated average • i.e., 20 to 24-day average • Reduces lab costs • minimizes samples collected
Sampling • Four-week sampling periods • Four 5-day sub-periods (currently) • Total of 20 days of sampling for each sample • Quartz Fiber Filters (QFFs) changed each week • Each sample • 1 PUF/XAD cartridge • 4 QFFs • New sample started every 28 days • 13 sampling periods per year • Samples collected by SCAQMD, BAAQMD and ARB staff
Changes Since Program Start • Sacramento site added January 2003 • Oakland collocated added January 2003 • PBDE monitoring started May 2003 • Flow rate data-loggers added June 2003 • 6 days/week to 5 days/week, January 2004
Analysis • U.S. EPA Established Procedures • Method TO-9A for dioxins/furans • Method 1668A for PCBs • Draft Method 1614 for PBDEs • Single sample; extract split 3 ways • Dioxin/Furans • PCBs • small portion for PBDEs • Archive portion • High resolution mass spectrometry • Contract Lab • AXYS Analytical Services, Ltd.
Analytical Cost • 13 sampling periods (moments) per year • 10 monitoring sites • 1 field blank per region per period • 1 collocated per region per period • 182 samples to lab per year • $1650 per sample for Ds/Fs & PCBs • $300,300 per monitoring year • New contract • $2835/sample for Ds/Fs, PCBs and PBDEs
Results • Field data (flow rate/sample volume) • cubic meters • Lab results in units of picograms/sample • (pico = 10-12) • Combine to calculate air concentration • femtograms/cubic meter • (femto = 10-15) • Convert to Toxicity Equivalence • fg TEQ/cubic meter
San Francisco Bay Area Sampling Period Averages2002 2003 Includes all valid samples for each sampling period
South Coast Area Sampling Period Averages2002 2003 Includes all valid samples for each sampling period
Field QC • Field Blanks (WHO TEQ, fg/m3) • average 0.48 for dioxins/furans • average 0.035 for PCBs • Collocated Samples (TEQ) • Boyle Heights, 15 sample pairs • average RPD; D/Fs = 5.5%; PCBs = 9.3% • Oakland, 10 sample pairs • average RPD; D/Fs = 6.8%; PCBs = 9.3%
Comparison of CADAMP Results • Key Factors to Consider in Comparing Data to Other Studies • TEFs • Detection limits (DL) • if elevated can impact TEQ • factored as DL, 1/2 DL or zero • Short vs. long duration sampling • Annual averages vs. few data points • Remote vs. rural vs. urban vs. source impacted
Summary of Monitoring Data • CADAMP annual averages range from • 13 to 43 fg TEQ/m3 for Dioxins/Furans • 2 to 10 fg TEQ/m3 for PCBs • On average CADAMP D/F results are • 15 x higher than NDAMN remote • 8 x higher than NDAMN Ft. Cronkhite • 1.8 x higher than NDAMN ‘rural’ • 1.6 x higher than other US urban results • Both D/Fs and PCBs show seasonal patterns
Public Web Pages • Includes information about: • Individual congener concentrations and total TEQ • Annual averages by sample, quarterly average, and • Site, regional, and statewide averages • Data downloadable in excel spreadsheets • Public release scheduled for mid-November 2004.
Program Benefits • Support needs assessment for future rule development • Track pre- and post-control due to regulatory reductions, e.g., burn barrels, diesel regulations, flame retardant • Identify potential emission sources using analytical tools • Help distinguish current and reservoir emission sources • Support for stationary and mobile dioxin studies
Conclusions • Data analysis will allow us to: -Identify possible emission sources - Evaluate significance of high values - Assess meaning of trends as they relate to emissions patterns and sources. • Data will be used to help prioritize future risk management strategies
References • 1. 2000 and 2001 NDAMN data supplied by US EPA: “The National Dioxin Air Monitoring Network (NDAMN): Measurements of CDDs, CDFs and Coplanar PCBs at 18 Rural, 8 National Parks, and 2 Suburban Areas of the United States: Results for the year 2000” and“Atmospheric Measurements of CDDs, CDFs and Coplanar PCBs in Rural and Remote Locations of the United States in the Year 2001 from the National Dioxin Air Monitoring Network (NDAMN)”, Organohalogen Compounds, Vol. 56 (2002) and Volume 66 (2004), respectively. • 2. Calcasieu Parish monitoring data from: • www.deq.state.la.us/evaluation/calcasieu/index.htm