Download
1 / 27
270 likes | 513 Views
National Ambient Air Quality Standards Program Update. Lydia Wegman, Office of Air Quality Planning & Standards, EPA Presentation at the WESTAR Spring Business Meeting April 3, 2007. Overview. Recent changes to the NAAQS review process Schedules for ozone, lead, NO 2 and SO 2 reviews

E N D
National Ambient Air Quality Standards Program Update Lydia Wegman, Office of Air Quality Planning & Standards, EPA Presentation at the WESTAR Spring Business Meeting April 3, 2007
Overview • Recent changes to the NAAQS review process • Schedules for ozone, lead, NO2 and SO2 reviews • Final ozone Staff Paper: overview • Recap of 1997 decision on ozone NAAQS • What’s new since last review • Health effects evidence and risk assessment results • Welfare effects evidence • Clean Air Scientific Advisory Committee (CASAC) conclusions and recommendations • EPA staff conclusions and recommendations
Review of NAAQS Review Process • “Top-to-bottom” review of the process by which NAAQS are reviewed and revised was requested by EPA Deputy Administrator Marcus Peacock in December 15, 2005 memo • Internal EPA workgroup formed to address key issues and make recommendations on the standard-setting process • Timeliness (i.e., how to complete NAAQS reviews on a 5-year cycle as required by Clean Air Act) • Consideration of the most up-to-date scientific information • Differences between scientific and policy judgments • Defining and expressing uncertainties in scientific and technical information • Meetings held with CASAC, stakeholders, and congressional staff • April 3, 2006 Workgroup report and cover memo from Bill Wehrum and George Gray (http://www.epa.gov/ttn/naaqs/naaqs_process_report_march2006.pdf) • Additional meetings with CASAC and the public in June 2006 • Peacock memo outlining revised process on December 7, 2006 (http://www.epa.gov/ttn/naaqs/memo_process_for_reviewing_naaqs.pdf) • Further modifications to address CASAC concerns outlined in March 2007 Peacock memo
New NAAQS Process: Key Steps • Planning: Early in the process, EPA will develop one integrated plan to guide the entire review • Plan will outline schedule, process, and key policy-relevant science issues • Science Assessment: The Criteria Document will be replaced by a more concise evaluation and synthesis of the most policy-relevant science • Science Assessment Support Document (SASD): compilation and characterization of new scientific studies • Integrated Science Assessment (ISA): Drawing from detailed SASD, provides concise evaluation and synthesis of the most policy-relevant science • ORD working to develop and implement process (state-of-the-art electronic database) to identify, compile, characterize, and prioritize new studies • Risk/Exposure Assessment: EPA will develop a more concise document, informed by the ISA, that focuses on key results, observations and uncertainties • Policy Assessment/Rulemaking: The Staff Paper will be replaced with an advance notice of proposed rulemaking (ANPR) containing a policy assessment that reflects Agency views, rather than staff views • ANPR will present a range of policy options for standard setting, and will include a description of the underlying interpretation of the scientific evidence and risk/exposure information that might support each option
New NAAQS Review Process: Flow Diagram Peer-reviewed scientific studies Science Assessment Support Document Integrated Science Assessment: concise evaluation and synthesis of most policy-relevant studies Integrated Plan: timeline and key policy-relevant scientific questions CASAC review and public comment Workshop on science-policy issues Draft ANPR: policy assessment reflecting Agency views on range of policy options and rationales Risk/Exposure Assessment: concise, quantitative assessment focused on key results, observations and uncertainties Review by CASAC and the public EPA advance notice of proposed rulemaking Agency decision making and draft proposal notice Interagency review Public comment period and CASAC review Interagency review EPA final decision on standards Public hearings and comments on proposal Agency decision making and draft final notice EPA proposed decision on standards Interagency review
Role of CASAC in New NAAQS Review Process • CASAC will continue to advise the Administrator on all key elements of the NAAQS review: planning, integrated science assessment, risk/exposure assessment, and policy options • In addition, at CASAC’s recommendation, EPA will hold initial “kickoff” workshop to receive input from experts, including CASAC members, to help the Agency formulate the draft integrated plan which will guide the entire NAAQS review • Each NAAQS review will continue to involve a series of consultations with CASAC, but these consultations will now involve evaluation of overlapping elements of the review (rather than sequential approach taken in past): • CASAC consultation on draft integrated NAAQS review plan • CASAC review of 1st draft ISA and draft risk assessment scope/methods plan • CASAC review of 2nd draft ISA and 1st draft risk/exposure assessment • CASAC review and comment on 2nd draft risk/exposure assessment • CASAC review and comment on final risk/exposure assessment and ANPR
Transition to New NAAQS Review Process • Current ozone NAAQS review will not be affected by the new process • Final Staff Paper: January 31, 2007 • NPR: June 20, 2007 • NFR: March 12, 2008 • Transition to new process will begin with Pb NAAQS review: Criteria Document finalized, 1st draft SP released December 2006, but now moving toward ANPR • NOx/SOx reviews: hybrid approach incorporating most elements of the new process • Next PM NAAQS review: first to fully implement new process (workshop to be held Summer 2007 to inform development of draft plan)
Last Ozone NAAQS Review: 1997 • Large number of new studies, particularly on 6- to 8- hour O3 exposures • Strongest evidence from controlled human exposure studies of healthy young adults showing adverse effects at levels as low as 0.08 ppm • Decreased lung function • Respiratory symptoms (e.g., chest pain, cough, shortness of breath) • Inflammation of the lungs • 8-hr averaging time more directly associated with health effects at lower O3 levels; 8-hr averaging time would effectively limit both 1- and 8-hr O3 exposures of concern • Also epidemiological evidence on aggravation of respiratory disease (e.g., increased hospital admissions and emergency room visits), with no discernible threshold • Results of exposure and risk assessments provide additional support for selecting 0.08 ppm level • New primary O3 standard established • 0.08 ppm, 8-hour average • Annual 4th-highest daily maximum O3 concentration measured at each monitor in an area • Averaged over 3 years • Replaced 0.12 ppm 1-hour average O3 standard • Secondary O3 standard set equal to the primary • Alternative form (SUM06) based on cumulative exposures proposed but not finalized
Ozone health effects overview: “Pyramid of effects” • Consistent and coherent effects seen across a wide range of health outcomes • Sensitive groups include: • Asthmatic children and other people with lung disease • All children and older adults, especially people active outdoors • Outdoor workers Adversity of Effects Proportion of Population Affected
New Health Evidence in This Review • New clinical studies: • Controlled human exposure studies done in chambers provide clearest and most compelling evidence for an array of health effects caused by O3 exposures, including: • Lung function decrements • Respiratory symptoms (e.g., pain on deep inspiration, cough, shortness of breath) • Biomarkers of lung injury including inflammation, increased airway permeability, and increased susceptibility to respiratory infection • Increased airway responsiveness (airway hyperreactivity) • Show lung function and respiratory symptom responses in healthy adults at O3 levels as low as 0.060 ppm (6.6-hr exposure under moderate exertion) • New epidemiological studies, including field and panel studies: • Numerous epidemiologic studies, including important new multi-city studies, add to previous evidence of O3-related respiratory morbidity effects (lung function decrements, symptoms, hospital admissions, emergency department visits) • Effects evaluated in outdoor workers, athletes, the elderly, hikers, school children, and asthmatics • Provide evidence of new health outcomes, including asthma medication use, school absenteeism, and cardiac-related effects
New Health Evidence in This Review (cont.) • New epidemiological studies (cont.) • Large multi-city studies and three meta-analyses provide evidence of a robust association between ambient O3 and mortality • Observed effects supported by new animal toxicological studies that provide new information regarding mechanisms of actions and biological plausibility • Effects observed especially in the warm season • Report effects at levels well below the level of the current standard • No clear evidence regarding threshold: if a population threshold does exist, likely well below level of current standard and possibly within range of background concentrations • Sensitive groups • Evidence indicates that people with asthma, especially children, experience more serious effects including larger lung function decrements, increased respiratory symptoms, increased airway responsiveness, and greater inflammatory responses • Thus, studies of healthy subjects likely underestimate O3-related effects on asthmatics and other sensitive groups • Sensitive groups include: asthmatic children and other people with lung disease; all children and older adults, especially those active outdoors, and outdoor workers
Human Health Exposure and Risk Assessments • Based on evidence from scientific studies, exposure and risk assessments provide additional insights on public health impacts and reductions in adverse health effects associated with current and alternative O3 standards • Focused on a range of health risks in 12 urban areas • Cities included: Atlanta, Boston, Chicago, Cleveland, Detroit, Houston, Los Angeles, New York City, Philadelphia, Sacramento, St. Louis, Washington D.C • Health endpoints: lung function decrements, respiratory symptoms, hospital admissions, mortality • CASAC concluded: analyses represent state-of-the-art, are “well-done, balanced, and reasonably communicated” • CASAC emphasized, and staff agree, that exposure/risk assessments do not capture national scale public health impacts or quantify the full range of O3-related adverse health effects • Exposure and risk results: • Gradual reduction in exposure and risk estimates between the point where air quality just meets current standard (0.084 ppm) and the points where air quality meets alternative 8-hr standards (i.e., 0.080 to 0.064 ppm) for all health effects analyzed -- no sharp breakpoint • CASAC and staff concluded that exposures and risks associated with just meeting current standard are important from a public health perspective and a significant decrease can be achieved by lowering the level of the standard
Welfare Effects: Vegetation • New studies strengthen conclusions from 1997 review: • Plant response to O3 depends on both cumulative nature and level of exposure; therefore, studies have focused on metrics that are seasonal and cumulative in nature (SUM06 and W126) • Current ambient concentrations in many areas of U.S. are sufficient to impair growth of numerous species • Vegetation effects (e.g., impairment of growth and productivity, foliar injury) can occur in areas that meet the current 8-hr standard (0.08 ppm) • Key sources of additional information on welfare effects • New free air field-based studies (e.g., FACE) on crops (soybeans) and trees (aspen, red maple, birch) support earlier open-top chamber studies on crops and seedlings • National-scale, standardized foliar injury surveys conducted by USDA Forest Service using formalized monitoring protocols document widespread injury on sensitive bioindicator plants • EPA’s risk assessment estimates significant impacts on crop yields and tree growth (seedlings and mature trees) • O3 effects on sensitive tree species, including loss of vigor and competitive advantage, could have implications for ecosystems • Cotton and potatoes had estimated yield losses as high as 9-15% and 5-10%, respectively, under O3 exposures that just meet the level of the current 8-hr standard
Number of monitored counties exceeding various W126 levels but meeting various 8-hr standard levels (based on 3-year average of monitor values from 2002-2004)
CASAC conclusions and recommendations Primary Standard • Unanimously concluded: “no scientific justification for retaining” the current primary O3 standard and that standard “needs to be substantially reduced to protect human health, particularly in sensitive subpopulations” • “New evidence supports and builds upon key, health-related conclusions” drawn in 1997 review and shows that current primary standard is not sufficiently health protective • Epidemiologic studies provide more evidence for morbidity and mortality effects at concentrations below the current standard • Clinical studies show effects in healthy individuals at levels as low as 0.06 ppm (Adams 2006) • People with asthma, and particularly children, have been found to be more sensitive and to experience larger effects • CASAC “unanimously recommends that the current primary O3 NAAQS be revised and that the level that should be considered … be from 0.060 to 0.070 ppm” • Unanimously concluded “there is no longer significant scientific uncertainty regarding CASAC’s conclusion that the current 8-hr primary NAAQS must be lowered” • Recommended specifying standard level in terms of O3 parts per billion Secondary Standard • “There is a clear need for a secondary standard which is distinctly different from the primary standard in averaging time, level and form.” • “A secondary standard of cumulative form and extending over an entire growing season will be far more effective than a secondary standard that is not cumulative in form and does not include the whole growing season.” • CASAC prefers the W126 form as potentially more biologically relevant, and recommended a range for 12-hour W126 of 7.5-15 ppm-hrs
Final Staff Paper conclusions Primary Standard • Taking into consideration the views of CASAC and public comments, staff concluded that currently available information supports consideration of revising current standard to afford greater public health protection, especially to sensitive groups, including asthmatic children and other people with lung disease, as well as all children and older adults, especially those active outdoors, and outdoor workers • Staff concluded that the evidence from clinical, epidemiologic, and toxicologic studies does not support retention of the current standard • Furthermore, exposure and risk assessment results supported CASAC’s conclusion that “achievable gains in protecting public health” can be accomplished by setting the level of the standard down to 0.060 ppm • Based on the weight of available scientific evidence and the results of the exposure and risk assessment, staff concluded that it is appropriate to consider a range of levels from somewhat below 0.080 ppm down to 0.060 ppm O3 Secondary Standard • Taking into consideration the views of CASAC and public comments, staff concluded that the current daily maximum 8-hr average form should be replaced with a more biologically relevant form based on cumulative exposure • Staff recommended consideration of W126 form, which sums daily weighted O3 values over a consecutive 3-month period in ozone season • Staff recommended a range for 12-hour W126 of 7-21 ppm-hrs
Lead NAAQS Review Status • Final Criteria Document issued in October 2006 • 1st draft Staff Paper and pilot phase risk assessment issued Dec. 2006: • air quality characterization • integration and evaluation of health information • human exposure analysis and health risk assessment • evaluation & analysis of information on vegetation damage and other welfare effects • Remainder of review: transition to new NAAQS process • 2nd draft Risk Assessment Report: Late July 2007 • CASAC meeting to review 2nd draft RA: Late August 2007 • Final Risk Assessment Report: ~ October 31, 2007 • Policy assessment (in form of ANPR): ~ November 30, 2007 • NPR: March 2008 • NFR: September 1, 2008 • CASAC meeting to discuss 1st draft SP: February 6-7, 2007 • CASAC letter on 1st draft SP received March 27, 2007: contains specific recommendations on level and form of the standard
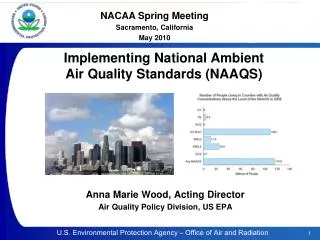
Current NAAQS Review:What’s Changed Since 1978? • Emissions reduced dramatically, but still arise from many sources; exposures also reduced • Ambient air concentrations • National mean reduced, but top 10% of sites still average almost 1 μg/m3 • Monitoring network provides incomplete coverage of today’s large emitters • Ambient non-air concentrations • Surface concentrations reduced in quiet forest soils & lake sediments • Trends less clear in systems near sources and with more energy (e.g., reentrainment near roadways) • Human Exposure – Children’s Blood Lead • U.S. population levels substantially reduced (median: 15 μg/dL to <5 μg/dL) • Adverse health effects observed at dramatically lower exposures • More robust evidence for broad array of effects • Focus on children’s IQ (vs. blood effects)
Criteria Document • Current review: Over 6000 newly available studies • Environmental effects: • While Pb loading to the environment has been greatly reduced, “a legacy of environmental Pb burden exists” • Some striking localized impacts observed around sources, may result from Pb acting alone or with other pollutants • Health effects: • New studies - “remarkable progress” since the mid-1980’s in understanding effects of Pb on health • Broad range of health effects associated with Pb exposure; data from across health disciplines provide evidence for coherence and plausibility • Strong evidence of adverse effects at distinctly lower blood-Pb levels (<10 µg/dL) on neurobehavioral development and function as well as cardiovascular, renal, and immune systems
Health Effects Evidence • Blood lead (Pb) – Predominant exposure/dose metric • In children, key effects at current exposures include: • Nervous system effects • Robust evidence, qualitative and quantitative, human and animal • Effects at blood levels below 10 μg/dL • Focus –for quantification- on children’s IQ • No discernable threshold • Larger incremental effect at lower blood lead levels • Red blood cell effects (i.e., affecting oxygen carrying capacity) • Robust evidence; basis for 1978 standard. • Effects on indicators of immune system function (at/below 10 μg/dL) • Implications for allergic responses, asthma • Susceptibility of young - human and animal evidence
Health Effects Evidence (cont.) • In adults, effects include: • Cardiovascular effects (blood Pb < 10 μg/dL) • Associations with bone and blood Pb • Blood pressure elevation, mortality • Increased risk for those with higher baseline blood pressure • Renal effects (blood Pb < 10 μg/dL) • Associations with bone and blood Pb • Increased risks for those with diabetes, hypertension, and chronic renal insufficiency • Other Pb associated effects: 10-30 μg/dL blood • Red blood cell effects • Neurological effects • Overall: • Lead causing effects at blood Pb < 10 μg/dL • Robust evidence: epidemiological and toxicological • Neurocognitive effects (e.g., IQ) in children at all levels studied
Ambient Lead - Air Quality Airborne lead (TSP) averaged across continuously operating monitoring sites, using each site’s maximum quarterly average (form of NAAQS).
CASAC conclusions and recommendations Primary Standard • Lead panel unanimously concluded: “lead should not be de-listed as a criteria air pollutant, as defined by the Clean Air Act … and that both the primary and secondary NAAQS should be substantially lowered.” • “Adverse health effects on both humans and other species appear at blood lead concentrations and environmental exposures well below those previously thought to impose important risks…. blood lead concentrations below 5 μg/dl are associated with unacceptable adverse effects.” • “past success in decreasing PbB concentrations in human populations are due in part to NAAQS controls…in the absence of such controls, there will be a significant possibility that blood-lead concentrations would begin to rise again….Maintaining appropriate Lead NAAQS is …an essential component of a national program to decrease the ongoing adverse effects of lead in children, adults, and in both terrestrial and aquatic ecosystems.” • The panel’s assumptions and preliminary analysis indicated that “there is a need for a substantial reduction in the primary Lead NAAQS to a level of about 0.2 μg/m3 or less.” • Recommended revising the Pb indicator to PM10 rather than TSP • Recommended “adopting monthly averaging as being more protective of human health in light of the response to blood lead concentrations that occur at sub-quarterly time scales, and … that the most protective form would be the highest monthly average in a year.” Secondary Standard • “From an environmental perspective, there are convincing reasons to both retain lead as a regulated criteria air pollutant and to lower the level of the current secondary standard.” • “Current atmospheric lead concentrations and deposition– combined with a large reservoir of historically-deposited lead in soils, sediments and surface waters– continue to cause adverse environmental effects in aquatic and/or terrestrial ecosystems, especially in the vicinity of large sources.” • “These effects persist in some cases at locations where current airborne lead concentrations are below the levels of the current primary and secondary lead standards.”