Download
1 / 35
420 likes | 780 Views
Calibrating NMR Logs to Core Measurements. Steven Morris Amoco EPTG. Presented to the Stavanger chapter of the Norwegian Formation Evaluation Society, Oct 1998. Objectives of NMR Core Calibration. Chose optimal T2 cutoff for bound water measurement

E N D
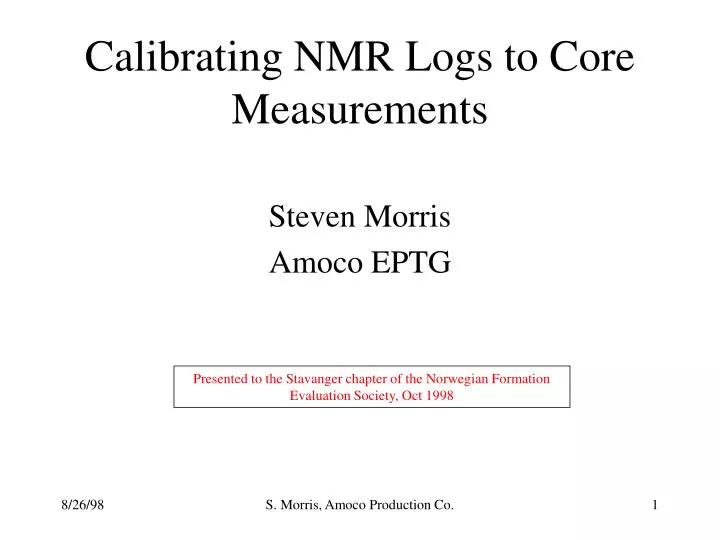
Calibrating NMR Logs to Core Measurements Steven Morris Amoco EPTG Presented to the Stavanger chapter of the Norwegian Formation Evaluation Society, Oct 1998 S. Morris, Amoco Production Co.
Objectives of NMR Core Calibration • Chose optimal T2 cutoff for bound water measurement • Chose denominator and exponent for Coates’ permeability equation S. Morris, Amoco Production Co.
Calibration Procedure Centrifuge Hg Injection Porous Plate Core NMR BVI calibration is very important because permeability predictions depends on accurate BVI Calibrate BVI Calibrate Permeability Core Perm data S. Morris, Amoco Production Co.
Suggested Measurement Program • Perform measurements by formation • 10 - 15 plugs per formation • Select a reasonable range of porosity and perm S. Morris, Amoco Production Co.
Suggested Measurement Program 1. Fresh state NMR 2. Standard Dean-Stark, Poroperm 3. NMR @ 100% saturation 4. Desaturation with centrifuge or porous plate 5. NMR @ desaturation 6. Mercury Injection 7. Thin section analysis S. Morris, Amoco Production Co.
Typical Saturated NMR Measurement S. Morris, Amoco Production Co.
Measurements Derived from T2 Distribution S. Morris, Amoco Production Co.
BVI T2 Cutoff Calibration • Use minimum average error technique • Compare measured BVI against NMR BVI as function of T2 cutoff • Select T2 cutoff which gives minimum average error over sample set S. Morris, Amoco Production Co.
Graphing BVI Prediction Error vs. T2 Cutoff S. Morris, Amoco Production Co.
Graphical representation of minimum average error technique. S. Morris, Amoco Production Co.
Setting up a table for calibration of T2 cutoff using minimum average error technique. S. Morris, Amoco Production Co.
Comparison of NMR BVI against measured BVI Gulf of Mexico Sandstone S. Morris, Amoco Production Co.
Understanding NMR BVI Prediction T2 Distributions at Partial Saturation As capillary pressure increases more water is drained from the rock. T2 peak of water phase decreases and shifts to the left T2 Exponent (ms) S. Morris, Amoco Production Co.
Understanding NMR BVI Prediction T2 Distributions at Partial Saturation Bound water calibrations are usually done using 100 psi air/brine centrifuge data, which typically gives a T2 cutoff of 33 ms in clean sandstones T2 Exponent (ms) S. Morris, Amoco Production Co.
Understanding NMR BVI Prediction NMR predicts BVI corresponding to capillary pressure of calibration set. Above this capillary pressure NMR predicts the actual amount of water in the sample, which will be below BVI at calibration capillary pressure. S. Morris, Amoco Production Co.
Understanding NMR BVI Prediction NMR BVI vs Bulk Water When the formation has more water that would be present at calibration capillary pressure, NMR measures BVI at calibration capillary pressure, other wise NMR measures the actual amount of water in the formation. S. Morris, Amoco Production Co.
100 90 Oil based mud, Water based mud HC zones Oil based mud, wet zones 80 70 Beware! 60 NMR SWI (percent) 50 40 SWI @ Calibration Pc 30 20 10 0 0 20 40 60 80 100 SW (percent) NMR SWI vs SW Unexpectedly low measurements of BVI can be a problem in hydrocarbon zone where oil based mud is used, causing gross overprediction of permeability S. Morris, Amoco Production Co.
Calibrating NMR Perm Prediction • Solve for permeability equation parameters by regression over sample set • Crossplot log of measured permeability against log of NMR function ( 2 FFI/BVI) • Perform linear regression • Derive perm denominator ‘a’ and exponent ‘b’ from regression solution S. Morris, Amoco Production Co.
Setting up perm regression S. Morris, Amoco Production Co.
Building a table for permeability calibration using regression. S. Morris, Amoco Production Co.
Graphical representation of perm regression. 10 20 30 40 50 60 70 80 90 Denominator ‘a’ 1 2 3 4 5 6 7 8 9 Graph of log(k) vs. log(phi^2*FFI/BVI) allows easy comparison of different regression solutions against default equation Scale for denominator ‘a’ gives visual feel for the sensitivity of ‘a’ to different parameters S. Morris, Amoco Production Co.
10 20 30 40 50 60 70 80 90 Denominator ‘a’ 1 2 3 4 5 6 7 8 9 North Sea Sandstone Perm Calibration for 25, 50 and 100 psi centrifuge saturations also using Dean Stark saturations Denominator ‘a’ increases with increasing capillary pressure of calibration. Calibration with Dean Stark saturation give some idea of in situ calibration S. Morris, Amoco Production Co.
Understanding NMR permeability prediction. North Sea Sandstone Formation Idealized Cap Pressure Curves S. Morris, Amoco Production Co.
10 20 30 40 50 60 70 80 90 Denominator ‘a’ 1 2 3 4 5 6 7 8 9 Understanding NMR permeability prediction. North Sea Sandstone Variation of Perm Calibration with Cap Pressure Denominator ‘a’ tends to increase as the square root of calibration capillary pressure S. Morris, Amoco Production Co.
Understanding NMR permeability prediction. North Sea Sandstone --- Variation of Perm Calibration with Cap Pressure Denominator ‘a’ Exponent ‘b’ Denominator ‘a’ tends to increase as the square root of calibration capillary pressure Exponent ‘b’ tends to approach 2 as calibration capillary pressure increases S. Morris, Amoco Production Co.
Using fresh state plugs to estimate perm calibration for abnormally low water saturation. 10 20 30 40 50 60 70 80 90 Denominator ‘a’ 1 2 3 4 5 6 7 8 9 North Sea Sandstone Calibration using fresh state water saturations gives better calibration in hydrocarbon zones where oil based mud is present S. Morris, Amoco Production Co.
Example -- North Sea Sandstone Calibration of core data directly to NMR log data Core porosity, Core BVI Core porosity, NMR log BVI Log Porosity, NMR log BVI Using core porosity and core BVI (from Dean Stark) gives best perm correlation) Log Porosity, NMR log BVI Using core porosity NMR log BVI still gives good perm correlation Using log porosity and NMR log BVI shows poor perm correlation and shows log porosity as source of permeability prediction error S. Morris, Amoco Production Co.
Example -- Gulf of Suez Sandstone Glauconitic Sandstones? ~10 ms T2 cutoff Clean Sandstones, ~33 ms T2 cutoff S. Morris, Amoco Production Co.
10 20 30 40 50 60 70 80 90 Denominator ‘a’ 1 2 3 4 5 6 7 8 9 Field Study Example --Gulf of Mexico Sandstone S. Morris, Amoco Production Co.
Field Study Example --Gulf of Mexico Sandstone S. Morris, Amoco Production Co.
10 20 30 40 50 60 70 80 90 Denominator ‘a’ 1 2 3 4 5 6 7 8 9 Example -- North Sea Chalk Use of default parameters for chalks leads to erroneous permeability prediction S. Morris, Amoco Production Co.
Example North Sea Chalk S. Morris, Amoco Production Co.
Conclusions • Calibrate BVI T2 cutoff using minimum average error technique. • Calibrate permeability using regression of log of Coates’ equation • Carefully assess possible deleterious effects of abnormally low water saturations in oil based mud. S. Morris, Amoco Production Co.
Other Considerations • Problems with inversion of raw data • lab data low noise, gives sharp peaks in T2 distribution • log data very noisy, causes spreading in T2 distribution • Problems with fixed cutoff model • Chalks and other strange rocks • ‘Tapered’ or ‘SBVI’ may be appropriate -- but not in oil based mud. S. Morris, Amoco Production Co.
Setting up a table to display different perm calibrations against default Coates’ equation. In case of questions…. S. Morris, Amoco Production Co.