Download
1 / 35
440 likes | 914 Views
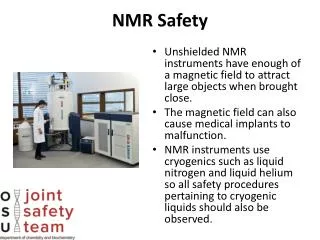
NMR. N uclear M agnetic R esonance. 1 H, 13 C, 15 N, 19 F, 31 P. One Level is more populated than the other Therefore a Resulting Net Magnetization will be Macroscopically Observable. CW C ontinous W ave.

E N D
NMR Nuclear Magnetic Resonance
One Level is more populated than the other Therefore a Resulting Net Magnetization will be Macroscopically Observable
The Exact Resonance Frequency Varies with the Chemical and Electronical Environment of the Nucleus – This is Called the Chemical Shift d (measured in ppm)
The Chemical Shift is Measured Relative to a Reference or ‘Standard’ ppm ‘parts per million’ d=(w-wref)/wref * 106 The most common standard for 1H and 13C NMR is TMS Tetramethylsilan CH3 CH3 – Si - CH3 CH3
NMR is ‘quantitative’ The intensity is measured as the integral below the resonancesignal. The intensities are proportional to the number of protons, that contribute to the signal.
Each Particular Arrangement of Nuclei has a Characteristic Coupling Pattern n Neighbors – (n+1) Lines A – B B – A – B C – B – A
example CH2 CH3 • No spin-spin coupling is observed if: • protons are separated by four or more single bonds,i.e., • H-C-C-C-H • protons are equivalent, i.e.,within a CH3 or CH2 group
Pick the molecule that gives rise to the following 1H NMR spectrum!
(almost) pure a D Glucose ~50% - 50% a/b D Glucose
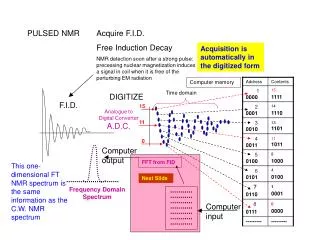
FT NMR ‘Pulse Echo’ NMR ‘Broadband Excitation’ Record ‘Transient Response’ FID Free Induction Decay Extract Frequencies by Fourier Transform to get NMR Spectrum
More Complex Experiments Measurement of Relaxation Times (‘Lifetimes’) Inversion Recovery
13C NMR Spectroscopy Sensitivity low: only 1.1% natural abundance Complicated 1H coupling pattern, no couplings between 13Cs (due to low abundance) S/N can be improved by 1H ‘broadband decoupling’ and FT averaging
3JHH coupling constants contain Geometrical Information on Torsion Angles ‘Karplus Relation’
Two Dimensional NMR Spectroscopy A Signal as a function of two times becomes after 2D FT Spectrum as a function of two frequencies Usually presented as ‘contour plot’ COSY Correlated SpectroscopY
Hb CH3g/d etc HN Ha
‘complex’ spectra can be resolved using 2dimensional NMR methods