Download
1 / 31
310 likes | 398 Views
Increasing Statistical Literacy among Students through the Census at School: Food Preference Survey. Presented by Suzanne King, Public Affairs Office Director U.S. Department of Agriculture, National Agricultural Statistics Service for the

E N D
Increasing Statistical Literacy among Students through the Census at School: Food Preference Survey Presented by Suzanne King, Public Affairs Office Director U.S. Department of Agriculture, National Agricultural Statistics Service for the UNECE Work Session on the Communication of Statistics Geneva, Switzerland, 18-20 June 2014 Session i: Statistical Literacy
Census at School • Census at School is an international classroom program for grades 4-12 that engages students in statistical problem solving. • Anonymous questionnaire/survey – Using questions that are directly related to the students is fun and encourages interest and engagement • Database of responses allows for student inquiry and analysis
Census at School - Background • Since its development in 2000 in the U.K., it is active in New Zealand, Australia, Canada, South Africa, Korea, Ireland, and Japan. • American Statistical Association, the Population Association of America, Census Bureau and a other partners launched the program in Washington, DC in 2010.
Census at School - Goals • To increase statistical interest and literacy among students to develop the next generation of statisticians. • Raise awareness of the use and importance of statistics and responding to surveys. • Increase survey and census response rates.
Census at School - Background • By 2010, the U.S. project included a questionnaire that tied to the international Census at School, teacher training, a successful program test pilot, a repository for data at the ASA, and statistical expertise. • A website at ASA housed the survey, response data, and resources. • Have – Infrastructure, statistical expertise • Need – Partner with network of teachers, schools; curriculum expertise; and project manager.
Partners • The National Agriculture in the Classroom organization had an established network of classroom teachers in all states and an interested national leadership. • The USDA National Institute for Food and Agriculture provided a collaboration point to bring ASA, NASS, and NAITC together.
Partner Goals • USDA NASS Goals - Increase use of the Census at School Program; - Increase awareness of NASS and use of survey and census data; - Increase response to its data collection among the farm and rural population; and - Develop a next generation of statisticians. • Ag in the Classroom Goal – Agricultural Literacy
Tie to the U.S. Education System • Each U.S. state has its own education standards, creating complexity and diversity. • New state-led standards known as the common core are unifying and bringing commonality to the U.S. school systems. • Most states have adopted these high-quality academic standards in Math, English, and Language Arts/Literacy.
Developing the Lessons • Use existing questionnaire to enhance program’s use and quality of existing and future data. • Extend learning opportunities. • Hire curriculum development specialist to work with statisticians. • Lesson plan addresses common core standards for grades 5-8 in Math, Language Arts, Nutrition, Social Studies, and National Family and Consumer Sciences.
Food Preference Survey • Timely, topical • Food and agriculture • Use Census at School survey • Lesson plan, activities and extensions
The Lessons • Students complete a brief online survey, analyze their class census results, and compare their class with random samples from students in the U.S and other participating countries. • Important issues addressed in the introduction include security of Internet and personal identifying information.
40 questions • 13 are the same across the international program • 27 are unique to the U.S. • Countries can add questions of unique importance or interest
The food preference lessons use 3 questions. • favorite foods, beverages for a class; • variables for the class; • numerical summaries for those variables; • type of graph to best show the data; • Discussion topics.
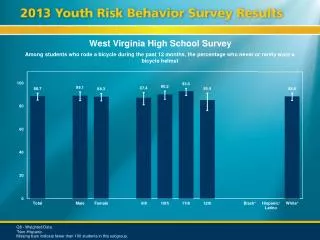
Sampler Results - Beverage • Random Sample of 500 U.S. responses on favorite drink. • Class favorites? • Response rates? • Difference between males and females in preferred beverage? • Compare class results with this random sample.
Sampler Results - Food • The activity asks if there is a potential association between favorite food and whether someone is a vegetarian.
Lesson Additions • Some Discussion Points: • Did the results surprise you? • Who might want to have this information for your class and the whole school and why? • How and where do the favorite food preferences fit in the MyPlate food categories and on the MyPlate graphic? • If the favorite foods represented a meal, what would the plate look like? Would it be balanced? Would it represent the food groups? • Examples of Additional Activities: • Conduct another random sample to see if results are different • Select a single food and beverage and research components; who grows or produced those components in the U.S. or internationally; Identify the 5 states or countries and estimate food miles, etc. • Plan a party. Use the data to determine menu, donations, fewest food miles.
Launching the Program • NASS and a partnering teacher conducted an instructional session to a receptive audience at the annual National Agriculture in the Classroom Conference in June 2013. • Other modes of promotion: • NAITC publication articles • Cross links and features on all members’ websites • USDA blog • Twitter • Article for ASA website
Measuring Progress • As of April 2014, there were more than 20,000 students from 46 states plus Washington, DC and Guam who had participated, and 931 registered teachers with 433 who have associated student data.
Next Steps • Project evaluation and expansion • Continue promotion and encourage use -Both Census at School and Food Preference • Project manager • Continue to encourage future statisticians, learn from other countries, and build statistical literacy worldwide.
Resources • U.S. Census at School - www.amstat.org/censusatschool • Food Preference Survey www.nass.usda.gov/Education_and_Outreach/ • International Census at School www.censusatschool.org.uk/international-projects • U.S. Census of Agriculture, USDA National Agricultural Statistics Service - www.agcensus.usda.gov • U.S. Agricultural Production, USDA National Agricultural Statistics Service www.nass.usda.gov • USDA My Plate - www.choosemyplate.gov • World Production Reports, USDA Foreign Agricultural Service www.fas.usda.gov/report.asp
Thank You Suzanne King Public Affairs Office Director USDA’s National Agricultural Statistics Service 1400 Independence Avenue, SW, Room 5029 Washington, DC 20250 Sue.king@nass.usda.gov 202-690-8122 www.nass.usda.gov www.agcensus.usda.gov