Download

1 / 24
240 likes | 339 Views
Understand system behavior, fix performance issues, essential for complex systems. Identify low-level system signatures. Extract, index, and count kernel function calls.

E N D
Fmeter: Extracting Indexable Low-level System Signatures by Counting Kernel Function Calls Tudor Marian, Hakim Weatherspoon, Ki-Suh Lee, and Abhishek Sagar Cornell University
System Monitoring • Key to understand system behavior • Identify & fix performance issues and bugs • Increasingly relevant as systems become complex • Large scale deployments are hard • Expensive having humans in the loop
Problem Statement • Traditional monitoring driven by human expertise • E.g., printf, debuggers, tracers, instrumentation, logging… • Few monitoring solutions satisfy all requirements below: Low-level Low overhead Formally indexable behavior / manipulated mechanically • Instruction level monitoring is too expensive • Hardware counter profiling relies on sampling: may miss events • High level metrics too general and application specific Datacenter scale Highly accurate/precise
Using System Signatures For Fun and Profit • Collect, label, and store past signatures • Identify/compare similar behaviors to past • Prune out problem space • Classification using labeled data • Identify behavior of interest • Generate and store more labeled signatures • Clustering and meta-clustering • Centroids of clusters – syndrome Centroid for Syndrome
Low-level System Monitoring at Scale User-space • Apps run on monolithic kernels • Large scale “cloud” deployment • Kernels & hypervisors are `fixed’ • User-provided external (binary) apps • Tradeoff: use kernel behavior as a proxy • Easy to deploy: e.g., do not instrument arbitrary binaries • Challenge: extract `useful’ low-level, low-overhead, precise, indexable behavior, and do it at scale ixgbe myri10ge Operating System Kernel Hardware Application Application
One Way of Looking at What the Kernel Does: Function Calls # tracer: function_graph # # CPU DURATION FUNCTION CALLS # | | | | | | | 0) | sys_open() { 0) | do_sys_open() { 0) | getname() { 0) | kmem_cache_alloc() { 0) 1.382 us | __might_sleep(); 0) 2.478 us | } 0) | strncpy_from_user() { 0) | might_fault() { 0) 1.389 us | __might_sleep(); 0) 2.553 us | } 0) 3.807 us | } 0) 7.876 us | } 0) | alloc_fd() { 0) 0.668 us | _spin_lock(); 0) 0.570 us | expand_files(); 0) 0.586 us | _spin_unlock(); # tracer: preemptoff # preemptoff latency trace v1.1.5 on 2.6.26-rc8 -------------------------------------------------------------------- latency: 29 us, #3/3, CPU#0 | (M:preempt VP:0, KP:0, SP:0 HP:0 #P:2) ----------------- | task: sshd-4261 (uid:0 nice:0 policy:0 rt_prio:0) ----------------- => started at: do_IRQ => ended at: __do_softirq # _------=> CPU# # / _-----=> irqs-off # | / _----=> need-resched # || / _---=> hardirq/softirq # ||| / _--=> preempt-depth # |||| / # ||||| delay # cmd pid ||||| time | caller # \ / ||||| \ | / sshd-4261 0d.h. 0us+: irq_enter (do_IRQ) sshd-4261 0d.s. 29us : _local_bh_enable (__do_softirq) sshd-4261 0d.s1 30us : trace_preempt_on (__do_softirq) [1654563.428782] Call Trace: [1654563.428788] [<ffffffff81490111>] do_region+0x51/0x150 [1654563.428792] [<ffffffff8148ff50>] ? bvec_next_page+0x0/0x10 [1654563.428796] [<ffffffff81490375>] dispatch_io+0xc5/0x100 [1654563.428800] [<ffffffff8148ff30>] ? bvec_get_page+0x0/0x20 [1654563.428803] [<ffffffff8148ff30>] ? bvec_get_page+0x0/0x20 [1654563.428807] [<ffffffff8148ff50>] ? bvec_next_page+0x0/0x10 [1654563.428812] [<ffffffffa006ef80>] ? io_complete_callback+0x0/0x450 [dm_gecko_mod] [1654563.428816] [<ffffffff81490645>] dm_io+0xc5/0x1c0 [1654563.428819] [<ffffffff8148ff30>] ? bvec_get_page+0x0/0x20 [1654563.428823] [<ffffffff8148ff50>] ? bvec_next_page+0x0/0x10 [1654563.428827] [<ffffffffa006d8d3>] dm_dispatch_io_bio+0x133/0x1b0 [dm_gecko_mod] [1654563.428833] [<ffffffff81149f85>] ? alloc_pages_current+0xa5/0x110 [1654563.428837] [<ffffffff811536a3>] ? new_slab+0x1c3/0x290 [1654563.428841] [<ffffffff8110e7a5>] ? mempool_alloc_slab+0x15/0x20 [1654563.428845] [<ffffffff8110eae9>] ? mempool_alloc+0x59/0x140 [1654563.428848] [<ffffffff8110e7a5>] ? mempool_alloc_slab+0x15/0x20 [1654563.428853] [<ffffffffa006ef80>] ? io_complete_callback+0x0/0x450 [dm_gecko_mod] [1654563.428857] [<ffffffffa006f8e8>] map_rw_io_job+0x1a8/0x500 [dm_gecko_mod] [1654563.428862] [<ffffffff8105f600>] ? default_wake_function+0x0/0x20 [1654563.428867] [<ffffffffa006fd5a>] gecko_map+0x11a/0x2b0 [dm_gecko_mod] [1654563.428871] [<ffffffff811967a6>] ? __bio_clone+0x26/0x70 [1654563.428876] [<ffffffff814879b8>] __map_bio+0x48/0x150 [1654563.428880] [<ffffffff81488610>] __clone_and_map+0x200/0x480 [1654563.428884] [<ffffffff8110e7a5>] ? mempool_alloc_slab+0x15/0x20 [1654563.428887] [<ffffffff8110eae9>] ? mempool_alloc+0x59/0x140 [1654563.428891] [<ffffffff81038c79>] ? default_spin_lock_flags+0x9/0x10 [1654563.428896] [<ffffffff814893a0>] __split_and_process_bio+0x160/0x1b0 [1654563.428901] [<ffffffff81131f98>] ? __get_user_pages+0x158/0x500 [1654563.428905] [<ffffffff814894f4>] _dm_request.clone.19+0x104/0x1b0 [1654563.428909] [<ffffffff814895c8>] dm_request+0x28/0x40 [1654563.428914] [<ffffffff812c0c58>] generic_make_request+0x2d8/0x5c0 [1654563.428918] [<ffffffff81488f4b>] ? dm_get_live_table+0x4b/0x60 [1654563.428922] [<ffffffff814891e1>] ? dm_merge_bvec+0xe1/0x140 [1654563.428926] [<ffffffff812c0fc9>] submit_bio+0x89/0x120 [1654563.428931] [<ffffffff8119a8dc>] dio_bio_submit+0xbc/0xc0 [1654563.428935] [<ffffffff8119b4b8>] direct_io_worker+0x258/0x420 [1654563.428940] [<ffffffff8119b8ea>] __blockdev_direct_IO+0x26a/0x2e0 [1654563.428944] [<ffffffff81198030>] ? blkdev_get_blocks+0x0/0xc0 [1654563.428948] [<ffffffff81186d70>] ? xattr_getsecurity+0x40/0xb0 [1654563.428952] [<ffffffff81198a37>] blkdev_direct_IO+0x57/0x60 [1654563.428956] [<ffffffff81198030>] ? blkdev_get_blocks+0x0/0xc0 [1654563.428961] [<ffffffff8110d6ea>] generic_file_direct_write+0xca/0x190 [1654563.428966] [<ffffffff8110db1c>] __generic_file_aio_write+0x36c/0x440 [1654563.428970] [<ffffffff81134faf>] ? vma_adjust+0x1cf/0x4a0 [1654563.428974] [<ffffffff81198416>] blkdev_aio_write+0x36/0x90 [1654563.428978] [<ffffffff811983e0>] ? blkdev_aio_write+0x0/0x90 [1654563.428983] [<ffffffff811a61f5>] aio_rw_vect_retry+0xc5/0x160 [1654563.428986] [<ffffffff811a6130>] ? aio_rw_vect_retry+0x0/0x160 [1654563.428990] [<ffffffff811a7560>] aio_run_iocb+0x70/0x190 [1654563.428994] [<ffffffff811a8361>] io_submit_one+0x161/0x2f0 [1654563.428998] [<ffffffff811a87d5>] do_io_submit+0x135/0x2b0 [1654563.429003] [<ffffffff811a8960>] sys_io_submit+0x10/0x20 [1654563.429007] [<ffffffff8100c002>] system_call_fastpath+0x16/0x1b
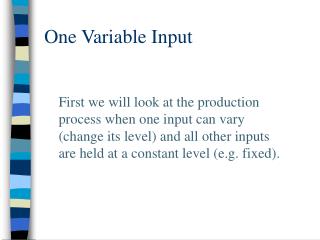
One Way of Looking at What the Kernel Does: Function Calls • E.g.: Kernel function call counts during boot-up • Looks familiar: power-law like distribution Word frequency in Wikipidia (Nov. 27, 2006)
Information Retrieval (IR) Approach To Automatic Indexing • “To be, or not to be: that is the question:” • Forget inferring the meaning from text structure • E.g., don’t parse into two consecutive infinitive phrases… • Count the words in corpus documents instead • Algebraic vector-space model • Represent text documents as vectors of TF-IDF terms
Insight: IR TF-IDF Driven Analogy • Mapping low-level system behavior to IR • `term’ -> kernel function call • ~30,000 core functions, ~300 of which are system calls • `document’ -> period of system activity • `corpus’ -> collection of system activities • Ignore semantic information • Consider only statistical properties of function calls • Ignore call stack traces, function call graph, etc.
Ignoring Semantic Information # tracer: preemptoff # preemptoff latency trace v1.1.5 on 2.6.26-rc8 -------------------------------------------------------------------- latency: 29 us, #3/3, CPU#0 | (M:preempt VP:0, KP:0, SP:0 HP:0 #P:2) ----------------- | task: sshd-4261 (uid:0 nice:0 policy:0 rt_prio:0) ----------------- => started at: do_IRQ => ended at: __do_softirq # _------=> CPU# # / _-----=> irqs-off # | / _----=> need-resched # || / _---=> hardirq/softirq # ||| / _--=> preempt-depth # |||| / # ||||| delay # cmd pid ||||| time | caller # \ / ||||| \ | / sshd-4261 0d.h. 0us+: irq_enter (do_IRQ) sshd-4261 0d.s. 29us : _local_bh_enable (__do_softirq) sshd-4261 0d.s1 30us : trace_preempt_on (__do_softirq) # tracer: function_graph # # CPU DURATION FUNCTION CALLS # | | | | | | | 0) | sys_open() { 0) | do_sys_open() { 0) | getname() { 0) | kmem_cache_alloc() { 0) 1.382 us | __might_sleep(); 0) 2.478 us | } 0) | strncpy_from_user() { 0) | might_fault() { 0) 1.389 us | __might_sleep(); 0) 2.553 us | } 0) 3.807 us | } 0) 7.876 us | } 0) | alloc_fd() { 0) 0.668 us | _spin_lock(); 0) 0.570 us | expand_files(); 0) 0.586 us | _spin_unlock(); [1654563.428782] Call Trace: [1654563.428788] [<ffffffff81490111>] do_region+0x51/0x150 [1654563.428792] [<ffffffff8148ff50>] ? bvec_next_page+0x0/0x10 [1654563.428796] [<ffffffff81490375>] dispatch_io+0xc5/0x100 [1654563.428800] [<ffffffff8148ff30>] ? bvec_get_page+0x0/0x20 [1654563.428803] [<ffffffff8148ff30>] ? bvec_get_page+0x0/0x20 [1654563.428807] [<ffffffff8148ff50>] ? bvec_next_page+0x0/0x10 [1654563.428812] [<ffffffffa006ef80>] ? io_complete_callback+0x0/0x450 [dm_gecko_mod] [1654563.428816] [<ffffffff81490645>] dm_io+0xc5/0x1c0 [1654563.428819] [<ffffffff8148ff30>] ? bvec_get_page+0x0/0x20 [1654563.428823] [<ffffffff8148ff50>] ? bvec_next_page+0x0/0x10 [1654563.428827] [<ffffffffa006d8d3>] dm_dispatch_io_bio+0x133/0x1b0 [dm_gecko_mod] [1654563.428833] [<ffffffff81149f85>] ? alloc_pages_current+0xa5/0x110 [1654563.428837] [<ffffffff811536a3>] ? new_slab+0x1c3/0x290 [1654563.428841] [<ffffffff8110e7a5>] ? mempool_alloc_slab+0x15/0x20 [1654563.428845] [<ffffffff8110eae9>] ? mempool_alloc+0x59/0x140 [1654563.428848] [<ffffffff8110e7a5>] ? mempool_alloc_slab+0x15/0x20 [1654563.428853] [<ffffffffa006ef80>] ? io_complete_callback+0x0/0x450 [dm_gecko_mod] [1654563.428857] [<ffffffffa006f8e8>] map_rw_io_job+0x1a8/0x500 [dm_gecko_mod] [1654563.428862] [<ffffffff8105f600>] ? default_wake_function+0x0/0x20 [1654563.428867] [<ffffffffa006fd5a>] gecko_map+0x11a/0x2b0 [dm_gecko_mod] [1654563.428871] [<ffffffff811967a6>] ? __bio_clone+0x26/0x70 [1654563.428876] [<ffffffff814879b8>] __map_bio+0x48/0x150 [1654563.428880] [<ffffffff81488610>] __clone_and_map+0x200/0x480 [1654563.428884] [<ffffffff8110e7a5>] ? mempool_alloc_slab+0x15/0x20 [1654563.428887] [<ffffffff8110eae9>] ? mempool_alloc+0x59/0x140 [1654563.428891] [<ffffffff81038c79>] ? default_spin_lock_flags+0x9/0x10 [1654563.428896] [<ffffffff814893a0>] __split_and_process_bio+0x160/0x1b0 [1654563.428901] [<ffffffff81131f98>] ? __get_user_pages+0x158/0x500 [1654563.428905] [<ffffffff814894f4>] _dm_request.clone.19+0x104/0x1b0 [1654563.428909] [<ffffffff814895c8>] dm_request+0x28/0x40 [1654563.428914] [<ffffffff812c0c58>] generic_make_request+0x2d8/0x5c0 [1654563.428918] [<ffffffff81488f4b>] ? dm_get_live_table+0x4b/0x60 [1654563.428922] [<ffffffff814891e1>] ? dm_merge_bvec+0xe1/0x140 [1654563.428926] [<ffffffff812c0fc9>] submit_bio+0x89/0x120 [1654563.428931] [<ffffffff8119a8dc>] dio_bio_submit+0xbc/0xc0 [1654563.428935] [<ffffffff8119b4b8>] direct_io_worker+0x258/0x420 [1654563.428940] [<ffffffff8119b8ea>] __blockdev_direct_IO+0x26a/0x2e0 [1654563.428944] [<ffffffff81198030>] ? blkdev_get_blocks+0x0/0xc0 [1654563.428948] [<ffffffff81186d70>] ? xattr_getsecurity+0x40/0xb0 [1654563.428952] [<ffffffff81198a37>] blkdev_direct_IO+0x57/0x60 [1654563.428956] [<ffffffff81198030>] ? blkdev_get_blocks+0x0/0xc0 [1654563.428961] [<ffffffff8110d6ea>] generic_file_direct_write+0xca/0x190 [1654563.428966] [<ffffffff8110db1c>] __generic_file_aio_write+0x36c/0x440 [1654563.428970] [<ffffffff81134faf>] ? vma_adjust+0x1cf/0x4a0 [1654563.428974] [<ffffffff81198416>] blkdev_aio_write+0x36/0x90 [1654563.428978] [<ffffffff811983e0>] ? blkdev_aio_write+0x0/0x90 [1654563.428983] [<ffffffff811a61f5>] aio_rw_vect_retry+0xc5/0x160 [1654563.428986] [<ffffffff811a6130>] ? aio_rw_vect_retry+0x0/0x160 [1654563.428990] [<ffffffff811a7560>] aio_run_iocb+0x70/0x190 [1654563.428994] [<ffffffff811a8361>] io_submit_one+0x161/0x2f0 [1654563.428998] [<ffffffff811a87d5>] do_io_submit+0x135/0x2b0 [1654563.429003] [<ffffffff811a8960>] sys_io_submit+0x10/0x20 [1654563.429007] [<ffffffff8100c002>] system_call_fastpath+0x16/0x1b
Fmeter Signatures • Defines signatures as weight vectors • Weight vector for document j: • Weight: • N: dimensionality, i.e., # of terms / kernel functions • Term Frequency: • Insensitive to run duration / machine speed / preemptions • Inverse Document Frequency: • Prevents bias towards popular functions (e.g., mmap()) Number of times function i appears in monitoring run j Size of corpus
How Do We Implement Fmeter? • Modified existing in-kernel Ftrace infrastructure • Generic Ftrace function tracer: • Builds kernel with `-pg’ flag • All function entries call mcount() • Re-write call-sites on 1st entry • Zero overhead when off prologue mcount() No-ops function General Purpose Code
How Do We Implement Fmeter? • Custom mcount() stub and embedded indirection • User-space daemon collects data • Constant retrieval O(# functions) • Instrument only core-kernel ixgbe myri10ge prologue mcount() function User-space slot Operating System Kernel slot index page index stub Application Application code per-CPU array base Hardware
Evaluation • Experimental setup • Dell PowerEdge R710, dual 2.93GHz Xeon X5570 (8MB shared L3), 12GB RAM, two Myri-10G NICs (CX4 &LR) • Quantify efficacy of statistical data analysis • Supervised machine learning (classification) • Unsupervised machine learning (clustering) • Hierarchical clustering example, K-means • Micro- and Macro-benchmarks • Compare against Ftace basic function tracer
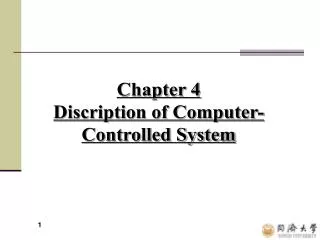
SVM Classification of System Behavior • ~360 signatures extracted: kcompile, dbench, scp • Used SVMlight with default polynomial kernel
Telling Subtle System Behaviors Apart User-space • ~360 signatures for myri10ge 1.5.1, 1.4.3, 1.5.1 with LRO off • End-to-end Fmeter overhead: • Ftrace receive throughput ~5Gbps • Fmeter receive throughput 10Gbps, i.e., line rate ixgbe Operating System Kernel myri10ge Hardware Application Application
Micro-benchmarks: Lmbench • Linux kernel vanilla vs. Fmeter vs. Ftrace • Average slowdown over all Lmbench tests • Fmeter 1.4 times slower than baseline • Ftrace 6.6 times slower than baseline
Macro-benchmarks: Apachebench • 512 concurrent connections • 1000 times in closed-loop (512000 requests) • Single 1400 byte HTML target file • Default apache2 configuration • Handles 150 simultaneous connections
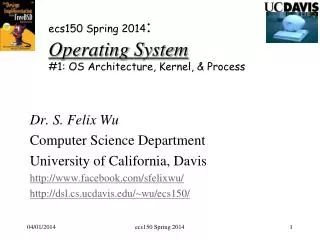
Macro-benchmarks: Kernel Compile • Compile Linux kernel patched with Fmeter • Time spent in user-space is the same • Fmeter overhead: 22% • Ftrace overhead (420% or 5.2x)
Limitations • Tracing only kernel function calls • Not capturing inlined functions, preprocessor macros • E.g., lists, hash-tables, page table traversals • Little fidelity for apps not calling into the kernel often • E.g., scientific applications • Signatures are kernel-version dependent • Uncertainty introduced by the measurements • All retrieved signatures uniformly perturbed
Future Work • Optimize stubs • One stub instead of per function stubs • Small cache of hot functions that fits in CPU L1/L2/L3 • Power-law function call distribution – cache may be small • Choose cache size (dynamically) based on CPU arch • Meta-clustering on centroids • Determine entire classes of similar behaviors • Schedule concurrent tasks with similar code-paths on same CPU • Evaluate signatures of complex activities
Related Work • System monitoring based on indexable signatures • Monitor (e.g., syscalls) -> model -> detect anomalies • System monitoring using performance counters • Oprofile, DCPI, ProfileMe, Chopstix, CyDat, Ganglia, CoMoN, Artemis • System monitoring based on logging • E.g., extract error conditions and replay traces (deterministically) from log containing error • System monitoring based on indexing logs • Mine logs for anomaly detection
Conclusion • Fmeter monitoring infrastructure • Extract formal, indexable, low-level system signatures • Represent signatures as weight vectors • Disregard semantic information like call stack traces • Signature extraction incurs low overhead • Amenable for manipulations by formal methods • Demonstrated the efficacy of Fmeter
Thank You! Questions? Availability: http://fireless.cs.cornell.edu/fmeter