Download
1 / 17
170 likes | 343 Views
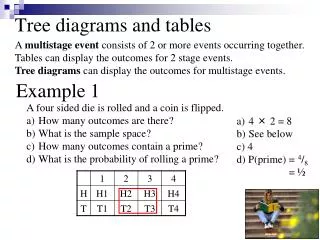
CS147 : Presentation by Mabel Thong (9/25/07). Finite State Machines. (Introduction to State Diagrams and tables).

E N D
CS147 : Presentation by Mabel Thong (9/25/07) Finite State Machines (Introduction to State Diagrams and tables)
A finite state machine (FSM) or finite state automaton (plural: automata) or simply a state machine is a model of behavior composed of a finite number of states, transitions between those states, and actions. A state is a particular set of instructions which will be executed in response to the machine's input. Definitions of an F.S.M.
An initial state or record of something stored someplace A set of possible input events A set of new states that may result from the input A set of possible actions or output events that result from a new state a state machine is :
A deterministic finite state machine or deterministic finite automaton (DFA) is a finite state machine where for each pair of state and input symbol there is one and only one transition to a next state. Example of Deterministic State Transition Diagram of a Finite State Machine 1 1 0 0 Start state The start state is usually shown drawn with an arrow into s1. Accept state is the end state and is usually represented by a double circle, shown on the left. S1 (which is also the start state) indicates the state at which an even number of 0s has been input and is therefore defined as an accepting state. :
A FSM can also be represented using a ‘State Transition Table’. As shown below: the combination of current state (B) and condition (Y) shows the next state (C). State Transition table A state table is essentially a truth table in which some of the inputs are the current state, and the outputs include the next state, along with other outputs.
Complete state table must include each possible combination of present states and input values, and no such combination may match more than one row of the table. Important Rule for State Table
Also called characteristic tables, single-dimension state tables are much more like truth tables than the two-dimensional versions. Inputs are usually placed on the left, and separated from the outputs, which are on the right. The outputs will represent the next state of the machine. One-dimensional state tables
Here's a simple example of a state machine with two states, and two combinatorial inputs: • S1 and S2 represent the single bits 0 and 1, since a single bit can only have two states. One Dimension State Table con’t
State transition tables are typically two-dimensional tables. The vertical dimension indicates current states. The horizontal dimension indicates events. The cells (row/column intersections) in the table contain the next state if an event happens (and possibly the action linked to this state transition). Two-dimensional state tables
Two-dimensional state tables con’t (S: state, E: event, A: action, -: illegal transition) The vertical dimension indicates current states, the horizontal dimension indicates next states, and the row/column intersections contain the event which will lead to a particular next state.
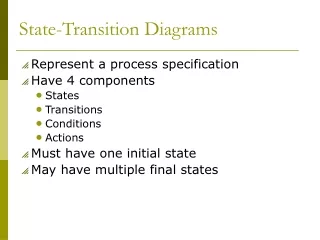
a state diagram for a finite state machine is a directed graph with the following elements: • States Q: a finite set of vertices normally represented by circles and labelled with unique designator symbols or words written inside them • Edges : represent the "transitions" between two states as caused by the input (identified by their symbols drawn on the "edges"). An 'edge' is usually drawn as an arrow directed from the present-state toward the next-state. • Start state Q 0: The start state qo is usually represented by an arrow pointing at it. • Accepting state(s) F: If used -- a collection of double circles used to designate accept states or final states. Elements of a State Diagram for an F.S.M.
State Transition Table State transition Diagram • The state diagram for M • M = (S, Σ, • S = {S1, S2}, • Σ = {0, 1}, T, s, A) • T is defined by the following state transition table The state S1 represents that there has been an even number of 0s in the input so far, while S2 signifies an odd number. A 1 in the input does not change the state of the automaton. When the input ends, the state will show whether the input contained an even number of 0s or not. Comparison of a State Transition Table with its Diagram.
State diagram has same situation as state table. Their conditions should be mutually exclusive, no input values should meet the condition of more than one arc. Important Rule for State Diagram
D Flip Flop State Diagram From this state diagram, an input of 1 into D will result in a transition to the 1 state an output of 1 on Q. An input of 0 into D will result in a transition to the 0 state an output of 0 on Q.
T Flip Flop State Diagram In this state Diagram: an input of 0 into T will cause it to stay in the (same) state an output of the same state on Q. An input of 1 into T will cause it to transition into the other state. The output on Q will be the opposite state that it was before.