Download
1 / 15
150 likes | 264 Views
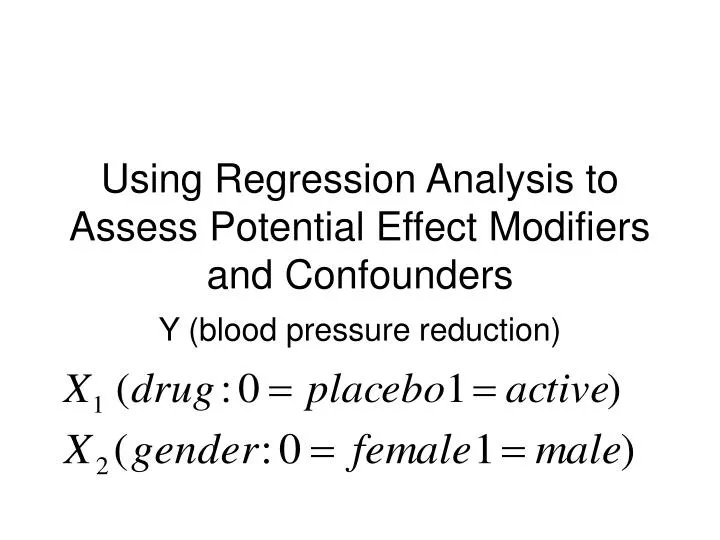
Using Regression Analysis to Assess Potential Effect Modifiers and Confounders. Y (blood pressure reduction). Question:. Does the effect of the drug on Mean BPR depend on the gender of the patient? It turns out that we can build a model to address this question. Implications of this model.

E N D
Using Regression Analysis to Assess Potential Effect Modifiers and Confounders Y (blood pressure reduction)
Question: • Does the effect of the drug on Mean BPR depend on the gender of the patient? • It turns out that we can build a model to address this question.
Implications of this model • By specializing the model to the females and then to the males we can see: • Measures the difference between the 2 drug effects • i.e. whether gender is an effect modifier
Sometimes a table can aid in understanding the implications of a model
Assess effect modification first • If gender is a modifier, its assessment as a confounder is rarely relevant. • If there is evidence that then one should present the gender specific estimates of the drug effect (together with their SEs and maybe CIs too) • No further testing of the components of this model is typically required. • Since we know that we then know that the drug has an effect and that the effect DEPENDS on the gender of the patient.
What if gender is not an effect modifier? • And we can then assess whether gender is a confounder by comparing • With
In other words: • By studying the context, using confidence intervals and other epidemiological ideas
What if the potential modifier/confounder is ‘continuous’? Say: age • Now look at: • As 2 straight lines in age • And so the drug effect is the difference:
Age specific drug effect • From the previous graph: • Compare the vertical difference between the red line and the blue line when ld = 3 with the vertical difference when ld =7. • For example, red minus blue (‘drug’ effect) is about -3 (when ld=3) and a bit more than 2 (when ld=7) • The next graph shows the ‘drug’ effect (de) versus ld demonstrating that ld is a modifier.
The next graph shows: • A ‘Drug’ effect adjusted for ld • Notice that the 2 lines are parallel and that the ‘drug’ effect (red line minus blue line) is the same for any value of ld • This fixed difference is the ‘adjusted’ drug effect
‘Crude’ drug effect • In the next graph, the 2 lines are horizontal (to emphasize that the effect is NOT adjusted for ld) • In this illustration, the adjusted effect and crude effect are nearly the same and hence there is no evidence of confounding • Remember, though, that if we had demonstrated modification, we would not even address the issue of confounding