Download
1 / 36
360 likes | 489 Views
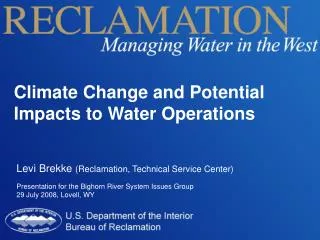
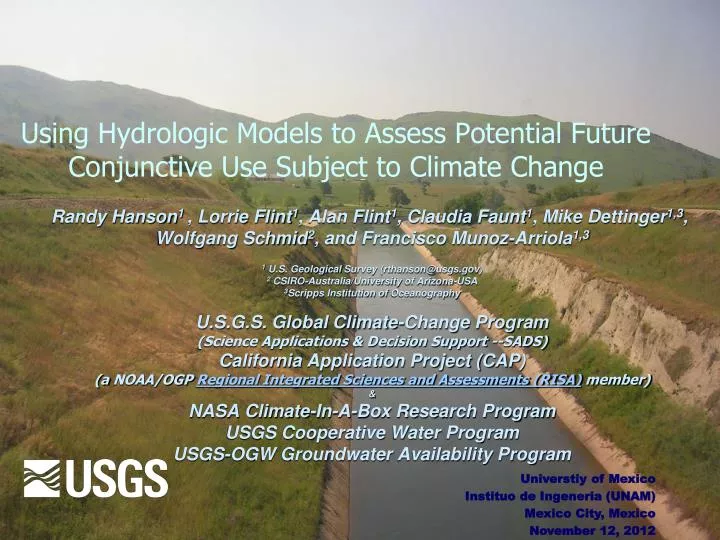
Using Hydrologic Models to Assess Potential Future Conjunctive Use Subject to Climate Change. Randy Hanson 1 , Lorrie Flint 1 , Alan Flint 1 , Claudia Faunt 1 , Mike Dettinger 1,3 , Wolfgang Schmid 2 , and Francisco Munoz-Arriola 1,3 1 U.S. Geological Survey (rthanson@usgs.gov)

E N D
Using Hydrologic Models to Assess Potential Future Conjunctive Use Subject to Climate Change Randy Hanson1 , Lorrie Flint1, Alan Flint1, Claudia Faunt1, Mike Dettinger1,3, Wolfgang Schmid2, and Francisco Munoz-Arriola1,3 1 U.S. Geological Survey (rthanson@usgs.gov) 2CSIRO-Australia/University of Arizona-USA 3Scripps Institution of Oceanography U.S.G.S. Global Climate-Change Program (Science Applications & Decision Support --SADS) California Application Project (CAP) (a NOAA/OGP Regional Integrated Sciences and Assessments (RISA)member) & NASA Climate-In-A-Box Research Program USGS Cooperative Water Program USGS-OGW Groundwater Availability Program Universtiy of Mexico Instituo de Ingeneria (UNAM) Mexico City, Mexico November 12, 2012
Today’s Presentation Climate Change/Variability Background Climate Issues & State of the Science Hydrologic Tools Conjunctive Use Analysis–Central Valley Example Outlook Sustainability: Development and use of water in a manner that can be maintained for an indefinite time without causing unacceptable environmental, economic, or social consequences. Conjunctive Use: Joint use and management of surface-water and groundwater resources to maximize reliable supply and minimize damage to the quantity or quality of the resource.
IS ONE PERSON’S CLIMATE CYCLE ANOTHER PERSON’S CLIMATE CHANGE?? (GLACIAL CYCLES) Weaker and Less Regular Stronger and Regular Climate Variability Quasi-PeriodicInterannual to Interdecadal changes in climate Climate Change Larger Cycles or monotonic/step changes in climate (anthropogenic?)
2 per mil 4X more Variable 8 per mil
Relation between Tree-Ring Indices, El Nino’s, and Precipitation (Hanson and others, 2002) DEFINITION OF FORCINGS CLIMATE VARIABILITY (1) AMO ~70yr (2) PDO 10-30 yr (3) Monsoonal Flow 6-10yr & Pineapple Express (4) El Nino(ENSO) 2-6yr (5) Annual 1-2yr
History of civilizations in relation to Climate Climate Change & Variability Multiple Features & Forcings (Stress) Not always synchronized everywhere USGS Office of Global Change Effects of Climate Variability and Change on Groundwater Resources of the United States Fact Sheet FS09-3074 (2009) By Jason Gurdak, Randall T. Hanson, and Timothy R. Green ENSO 2-6 year cycles PDO 10 – 30 year cycles AMO ~70 year cycle
(Gurdak, Hanson, and Green, 2009) Climate Reconstruction from Tree-ring Indices for Temperature (Bristle-Cone Pines, Mt. Humphreys, AZ) and Precipitation (Ponderosa Pine, Sedona, AZ) (Salzer and Kipfmueller, 2005) Periodicities of Climate Variability 14, 18, 22, 24, 44 & 68 years PDO AMO Decline and relocation of SinAgua in Colorado Plateau-Mogollon Rim 1947- 1996 Decline and relocation of Anasazi in Four Corners Region Little Ice Age Medieval Warm Period 900-1300 AD
Paleo-Extreme Climate Events Central Valley, California Is one person’s Climate Change another person’s Climate Variability?? NO--There are natural & anthropogenic components & competing driverssuch as urbanization Mega-Droughts > 100 years long (900 – 1250 A.D.) Medieval Drought 1210-1350A.D. Mega Drought 910-1100 A.D. Little Ice Age 1350-1850 Medieval Warm Period 900-1300 Modified from "Holocene climates and connections between the San Francisco Bay estuary and its watershed--A review", by Malamud-Roam, Dettinger, Ingram, Hughes, and Florsheim, 2007, San Francisco Estuary and Watershed Science, 28p.
Today’s Presentation Climate Change/Variability Background Climate Issues & State of the Science Hydrologic Tools Conjunctive Use Analysis Outlook
Global Analysis of Water Stress from Major Surface-water Drainages • Large part of World’s Population with Water Stress • Rising Water Demands outweigh effects of greenhouse warming-climate change through 2025 • Direct human impacts on global water supply poorly articulated but important to larger global change question (Vorosmarty et al., April, 2010, Science)
Additional Urban-Demand and Climate-Change Issues Climate Change and Cities: First Assessment Report of the Urban Climate Change Research Network (Cambridge University Press) http://www.cambridge.org/us/catalogue Urban Climate Urban Heat Islands, Air pollution & Climate extremes Governance/Management Transboundary, Capture of Unappropriated Runoff & Environmental Flows 1st Managed Resources Agriculture to Urban, Water-Energy Nexus, & Formal vs Informal Supply • Risk Framework • Climate Hazards • Vulnerabilities • Adaptive Capacity • Sustainability
Today’s Presentation Climate Change/Variability Background Climate Issues & State of the Science Hydrologic Tools Coupled Integrated Hydrologic Models Supply & Demand Modeling Framework Physically Based Use and Movement All the water All the time Everywhere Conjunctive Use Analysis – Central Valley Example Outlook
Types of Models USED to SIMULATE CONSUMPTION • Physically Based Integrated Hydrologic Models MODFLOW-FMP, etc • Simulate Past/Future, Secondary effects, Use Fundamental Data, All features in one model • Allocation/Optimization Models RiverWare, CalSim, Calvin, PowerSIM, WEAP, etc. • Simulate Past/Future, Limited ability to simulate Secondary or rate controlling effects , Limited connections with groundwater • Remote-Sensing Estimators SEBAL, METRIC, etc • Simulate past/present, Integrated estimates don’t allow determination of sources of water consumed
Supply-and-Demand Modeling Framework Connected to Nature and Humanity (Schmid and Hanson, 2009; Hanson et al., 2010)
One Water Single resource(Precipitation, surface water and groundwater) • Competition for Water Demand for water resources People, Agriculture Environment (Entire Central Valley not just Sacramento and San Joaquin) • Sustainable developmentComplex system requires integrated water-management approach Linked models used to support this analysis • Availability/Sustainability Changes in streamflow, groundwater storage, regions suitable for agriculture, and dynamics between natural and societal water-supply demands • Groundwater Effects Significant changes in Flows, Storage, & Secondary effects on multiple time scales (Flow-centric & Storage-centric Indicators? ) • Climate Variability/Change Analysis Management provided with observationally informed modeling and resource analyses • Climate Change Important influences on management strategies for conjunctive/sustainable use on periods of 100 years or more (ENSO, NAMS/Pineapple Exp, PDO, AMO, + Change) RELATION TO USGS MISSIONS SUSTAINABILITY/Conjunctive Use Central Valley
How Conjunctive Use/Sustainability Analysis Help Stakeholders? • Climate Vulnerabilities? Extreme Events, Sustained Events, Permanent changes to system, Unsustainable adaptation • Primary Effects More dry Springs, Higher minimum temperatures, More cloudy/foggy days, More windy days, Amount/timing of snowmelt runoff, Frequency of wet years, Frequency of storms, Length of growing seasons, etc. • Secondary Effects Land Subsidence, Seawater intrusion, Decreased streamflow gains/losses, Increased soil salinization, Decreased soil moisture, Land-use adaptation (esp. urbanization!) • Variables/metrics used for vulnerabilities? Focus of current research and analysis of coupled models -- most “Indicators” only based on data. Need to make decisions on indicators from data and physically-based models. • Ensemble Analysis Adequate? Maybe not -- the traditional statistical and probabilistic approach to synthesis of results may not capture linkages or secondary-limiting factors of conjunctive use. Indicators from ensembes may not catch extremes or tipping points • Current Observational Networks & Assoc Data Adequate? Maintenance of Input Data Streams for regional hydrologic models one of biggest challenges and needs Part of DSS should include integrated ground and remote-sensing networks in Mountains & Valleys Support of SELF-UPDATING MODELS
Decision Support System (DSS) & LINKAGE BETWEEN GCM and BCM & CVHM Supply-Constrained/Demand-Based Hydrologic Model System Statistical Downscaling 12km 4km Bias Corrected 270m Precipitation, Temperature, & Ref-ET (Constructed Analogs Method) Run Basin Characteristic Model(BCM) of all Central Valley Watersheds Estimate Mountain Runoff/Recharge to Rivers & Reservoirs Run GCM Model (CM2/PCM) Farm Process (FMP) Input of Monthly Precipitation & Reference ET Resamplingonto Valley-Wide (CVHM) MODFLOW-FMP GridSimulate Agricultural Supply & Demand Build Stream Routing/Deliveries 41 River Inflows, 66 Diversions, 42 Nonrouted deliveries (Reservoir Releases, Unregulated Streamflows & Project Water Deliveries) Run Central Valley Hydrologic Model (CVHM) (MODFLOW-FMP) DSS Analyze Flows Groundwater, Surface-water, & Landscape Budgets DSS Analyze Levels Groundwater Levels, Streamflow, & Land Subsidence DSS Analyze Supply/Demand Drought Response & Adaptation
Basin Characteristics Model (BCM) Simulates Precipitation-Runoff/Recharge from downscaled climatology in the mountain watersheds surrounding the Central Valley (Sierra Nevada and Coast Ranges Mountains) Also Developing Linkage with VIC Precipitation-Runoff Model Linkage of Global Climate Model to Regional Hydrologic Models
Today’s Presentation Climate Change/Variability Background Climate Issues & State of the Science Hydrologic Tools Conjunctive Use Analysis – Central Valley Example Outlook
A2- Scenario & Model Linkages • Future projection (A2) Extreme conditions - generally characterized as climatically quite, warm, substantially drier, assumes high growth in population, regionally based economic growth, and slow technological changes that represents “heavy emissions" and "business as usual" increase in future greenhouse emissions (Cayan et al., 2009). Reduced Snowfall, reduced Precipitation, Increased Temperature and ET • Model Assumptions: • (1) No Adaptation Land use (Agriculture, Urban, & Native) held constant at 2006. • (2) Future urban water use Increase 1.2% per year through at least 2040. • (3) Sea-Level rise GW only One meter rise with monthly variation in sea level at Delta controls groundwater outflow. • GCM MHWM (BCM) & CVHM (MF-FMP) used to evaluate potential effects of extreme climate change on conjunctive use of water Runoff & recharge from mountains, irrigation supply & demand, and groundwater, surface water, and agricultural components • Simulation Response metrics of Conjunctive Use SW Diversions, streamflow and infiltration/base-flow, groundwater storage, and related effects potential land subsidence and groundwater/surface-water relations in the Sacramento Delta.
Climate-Change Drivers of Conjunctive Use • Cumulative Precipitation & Temperature Downscaled • Shows A2 Scenario at Davis with the potential for • Decreased Precipitation • Increases in Temperature of +2 to+4C & ET • Sustained droughts in the 21stCentury • (10-15% Drier) Precipitation Ref-ET Max-Temp Min-Temp 2009 (USGS Prof. Paper 1766)
Discharge Reduced by 20 – 65%Largest in North & Central • Mean total basin discharge for • 2010-2020, • 2080-2090, • Percent reduction in discharge between the 2 decades, for each of the 43 basins in the study area.
Current (1962-2003) modeled and future 20-year projections of total basin discharge for 4 basins in the study area, depicted as mean (black bar), standard deviation (white box), and range (vertical lines). Percent change in future mean discharge from current mean is indicated for each 20-yr period. Streamflow Reductions of ~30 – 40% from major Rivers flowing from Sierra’s to Central Valley in later decades of 21st Century Base Base 9% 2% 1% 7% -16% -18% -16% -17% -34% -41% Base Base 21% 9% 15% -3% -6% 6% -7% -12% -37% -35%
Historical Change in Groundwater Storage (Water Years 1961 – 2003) Agricultural and Urban Water Supply 20% of a groundwater pumped in USA Faunt, C.C., Hanson, R.T., Belitz, Kenneth, and Rogers, Laurel, 2009, California’s Central Valley Groundwater Study: A Powerful New Tool to Assess Water Resources in California's Central Valley: U.S. Geological Survey Fact Sheet 2009-3057, 4 p. ( http://pubs.usgs.gov/fs/2009/3057/)
Conjunctive Use Transition from Surface-Water to Groundwater Use Intermittent Droughts Sustained Drought Irrigation Demand GW Supply SW Supply Predominantly Surface-water Deliveries Predominantly Groundwater Deliveries Irrigation Supply/Demand • Historical Surface-water to groundwater deliveries averaged about 1.33-to-1, (ranging from 2-to-1 wet periods to 1-to-3 during persistent dry periods) • GFDL-A2 scenario yields modeled ratios of surface-water to groundwater deliveries averaged about 1-to-2.75 (ranging from 1-to-1 wet periods to 1-to-3 during dry epochs)
Less Streamflow Infiltration Intermittent Droughts Sustained Drought More Groundwater Depletion Predominantly Surface-water Deliveries Predominantly Groundwater Deliveries More Compaction Land Subsidence
A2-Reduction in Surface-Water Diversions for Riparian Habitat on the Tuolomne River, San Joaquin Valley, Central Valley, California TUOL_0142 2053 2099 Water diverted for maintaining Riparian Habitat from the Central Sierras may become intermittently unavailable in 21st Century
Continued Increase in Groundwater Demand Increased Pumpage Increased Declines in groundwater Levels
Old and New Subsidence Renewed Subsidence in Historical Areas Largest new Subsidence Adjacent to Sierras where Surface-water Deliveries for Irrigation become less Additional subsidence in growing Urban areas Urban Areas Canals Used for Surface-water Delivery System (Hanson et al., 2010)
Summary of A2 Scenario Simulation of 21st Century • IncreasedGroundwater Storage Depletion under A2 scenario for 21st Century in Central Valley • IncreasedLand Subsidence throughout Central Valley and especially in the Tulare Basin and areas adjacent to Sierras (southern Central Valley) • Increasedstreamflow infiltration and decreased groundwater outflow in the Sacramento Delta from 1-meter rise in sea level & 1.2% per year Urban Water Growth (model sensitive to even larger urban-demand growth rates!) • DecreasedPrecipitation Intermittent droughts in first half of century followed by sustained drought in 2nd-half of 21st Century • DecreasedOutflow at the Delta plus many rivers & diversions • Water-Use TransitionSurface-water dominated irrigation supplies to groundwater supplies with sustained drought. • No Operational DroughtSimulated capacity of sw/gw supply in system still greater than combined potential demand on conjunctive-use system • Climate Change and Increased Urban water use Both affect sustainability land subsidence and reduced outflow at the Sacramento Delta • GCM-MHWM-CVHM Linkage Coupled physically-based, supply-constrained, and demand driven models Basis for a Decision Support System Evaluate Outflow of streamflow at the Delta, Streamflow, Surface-water Diversions, Land Subsidence, & Drought Scenarios, Supply-&-Demand Components • Hydrologic projections of a Century are more reliable in trends and changes than actual outcomes
Today’s Take-Home Messages One Water Linked & Integrated Models and Observation networks needed for Physcially-based Resource Analysis (Self-Updating Models DSS & Indicators) Sustainability, Conjunctive Use, Adaptation Controlled by Secondary effects Management horizons may range from years-decades to more than a Century (2050 time frame may be inadequate) Multiple Stressors on Resource Climate change, Urbanization, Agricultural, Environmental
Today’s Presentation Climate Change/Variability Background Climate Issues & State of the Science Hydrologic Tools Conjunctive Use Analysis – Central Valley Example Outlook
Develop Tools for Analysis of Water Resources • (Conjunctive-Use, Adaptation, Sustainability) • Connect to Remote Sensing Data-Stream Linkages Self-Updating Models & ground-based networks • More Accurate Projections with Regional Climate Modeling Coastal and intermontane Agricultural Regions • Salinity Management Linkages • Visualization Tools For Managers • Connect to Water Allocation Models • Develop Decision Support Systems for Agricultural, Urban, & Environmental Supply
USGS Integrated Hydrologic Models Supply-Constrained & Demand-Driven Conjunctive Use Analysis Principal Investigator Randy Hanson rthanson@usgs.gov San Diego, CA “A method for physically based model analysis of conjunctive use in response to potential climate changes”, can be found here: http://www.agu.org/pubs/crossref/2012/2011WR010774.shtml To learn more about USGS work on climate change, please visit: http://www.usgs.gov/global_change/ For more information refer to USGS Office of Groundwater Software:http://water.usgs.gov/nrp/gwsoftware/fmp/fmp.html/ USGS WEBINAR CLIMATE-CHANGE (Hanson et al. 3/17/2011) (http://wwwrcamnl.wr.usgs.gov/wrdseminar/playwrd.htm?id=17mar2011) California-Nevada Applications Program (CNAP) & The California Climate Change Center (CCCC) : http://meteora.ucsd.edu/cap/ NASA’s Climate-In-A-Box: http://climateinabox.nasa.gov/ NASA’s Modeling GURU: https://modelingguru.nasa.gov/index.jspa The End? Thank You!