Download
1 / 1
10 likes | 95 Views
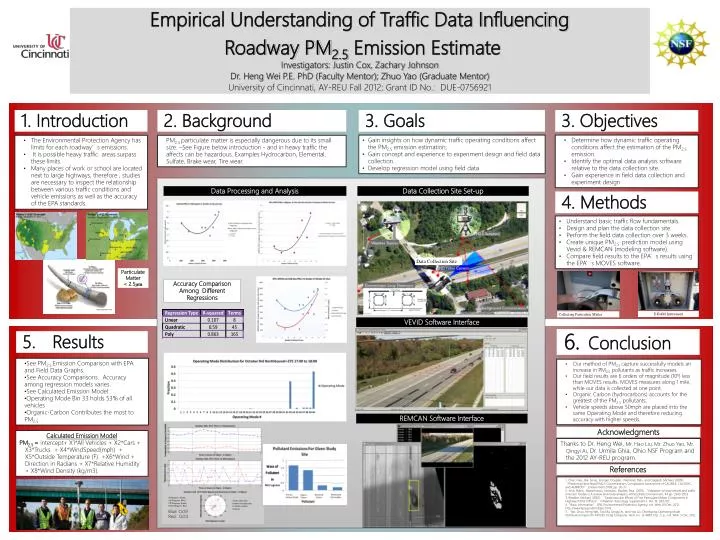
Empirical Understanding of Traffic Data Influencing Roadway PM 2.5 Emission Estimate Investigators: Justin Cox, Zachary Johnson Dr. Heng Wei P.E. PhD (Faculty Mentor); Zhuo Yao (Graduate Mentor) University of Cincinnati, AY-REU Fall 2012; Grant ID No.: DUE-0756921. 6. Conclusion.

E N D
Empirical Understanding of Traffic Data Influencing Roadway PM2.5 Emission Estimate Investigators: Justin Cox, Zachary Johnson Dr. Heng Wei P.E. PhD (Faculty Mentor); Zhuo Yao (Graduate Mentor) University of Cincinnati, AY-REU Fall 2012; Grant ID No.: DUE-0756921 6.Conclusion 3. Objectives 4. Methods 3. Goals 1. Introduction 2. Background Acknowledgments Thanks to Dr. Heng Wei, Mr. Hao Liu, Mr. Zhuo Yao, Mr. Qingyi Ai, Dr. UrmilaGhia, Ohio NSF Program and the 2012 AY-REU program. • Our method of PM2.5 capture successfully models an increase in PM2.5 pollutants as traffic increases. • Our field results are 6 orders of magnitude (106) less than MOVES results. MOVES measures along 1 mile, while our data is collected at one point. • Organic Carbon (hydrocarbons) accounts for the greatest of the PM2.5 pollutants. • Vehicle speeds above 50mph are placed into the same Operating Mode and therefore reducing accuracy with higher speeds. • The Environmental Protection Agency has limits for each roadway’s emissions. • It is possible heavy traffic areas surpass these limits. • Many places of work or school are located next to large highways, therefore , studies are necessary to inspect the relationship between various traffic conditions and vehicle emissions as well as the accuracy of the EPA standards. References • Gain insights on how dynamic traffic operating conditions affect the PM2.5 emission estimation; • Gain concept and experience to experiment design and field data collection. • Develop regression model using field data • PM2.5 particulate matter is especially dangerous due to its small size. –See Figure below introduction - and in heavy traffic the affects can be hazardous. Examples Hydrocarbon, Elemental, Sulfate, Brake wear, Tire wear. • Determine how dynamic traffic operating conditions affect the estimation of the PM2.5 emission. • Identify the optimal data analysis software relative to the data collection site. • Gain experience in field data collection and experiment design • Understand basic traffic flow fundamentals. • Design and plan the data collection site. • Perform the field data collection over 3 weeks. • Create unique PM2.5 prediction model using Vevid & REMCAN (modeling software). • Compare field results to the EPA’s results using the EPA’s MOVES software. • 1. Chen, Hao., Bai, Song., Eisinger, Douglas., Niemeier, Deb., and Claggett, Michael. (2009). “Predicting Near-Road PM2.5 Concentrations Comparative Assessment of CALINE4, CAL3QHC, and AERMOD”. Environment 2009, pp. 26-37. • 2. Smit, Robin., Ntziachristos, Leonidas., Boulter, Paul. (2010). “Validation of road vehicle and traffic emission models e A review and meta-analysis). Atmospheric Environment, 44 pp. 2943-2953. • 3. Riediker, Michael. (2007). “Cardiovascular Effects of Fine Particulate Matter Components in Highway Patrol Officers.” Inhalation Toxicology, Supplement 1, Vol. 19, p99-105. • 4.“Basic Information” EPA. Environmental Protection Agency, n.d. Web. 03 Dec. 2012. http://www.epa.gov/pm/basic.html. • 5. Yao, Zhuo, Heng Wei, Tao Ma, Qingyi Ai, and Hao Liu. Developing Operating Mode Distribution Inputs for MOVES Using Computer. Tech. no. 13-4899. N.p.: n.p., n.d. Web. 3 Dec. 2012. Data Processing and Analysis Data Collection Site Set-up Data Collection Site Particulate Matter < 2.5μm Accuracy Comparison Among Different Regressions E-BAM Instrument Collecting Particulate Matter VEVID Software Interface 5. Results • See PM2.5 Emission Comparison with EPA and Field Data Graphs. • See Accuracy Comparisons. Accuracy among regression models varies. • See Calculated Emission Model: • Operating Mode Bin 33 holds 53% of all vehicles • Organic-Carbon Contributes the most to PM2.5 REMCAN Software Interface Calculated Emission Model PM2.5 = intercept+ X1*All Vehicles + X2*Cars + X3*Trucks + X4*WindSpeed(mph) + X5*Outside Temperature (F) +X6*Wind + Direction in Radians + X7*Relative Humidity + X8*Wind Density (kg/m3). 90 Degrees: North 180 Degrees: West 270 Degrees: South 0/360 Degrees: East Arrow direction denotes the direction in which wind is moving. Blue: Oct9 Red: Oct3