Download
1 / 19
190 likes | 338 Views
Recreational Use Survey. Survey Results. Survey Objectives. QUANTIFY THE RECREATIONAL USES OF OHIO RIVER. DESCRIBE THE LEVEL OF USE IN TERMS OF NATIONAL CRITERIA CATEGORIES. Beach use, moderate use, light use. DETERMINE WHEN THE USES OCCUR. Ohio River criteria apply May-Oct.

E N D
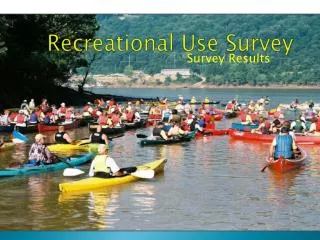
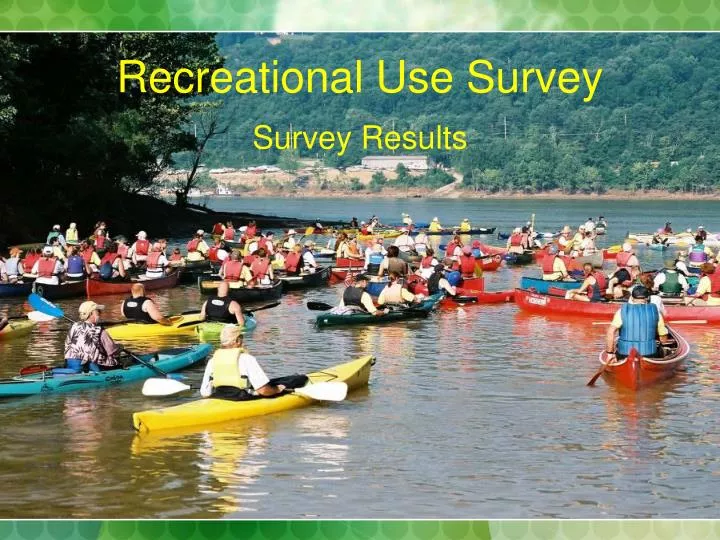
Recreational Use Survey Survey Results
Survey Objectives • QUANTIFY THE RECREATIONAL USES OF OHIO RIVER. • DESCRIBE THE LEVEL OF USE IN TERMS OF NATIONAL CRITERIA CATEGORIES. • Beach use, moderate use, light use. • DETERMINE WHEN THE USES OCCUR. • Ohio River criteria apply May-Oct.
Survey Objectives • QUANTIFY THE RECREATIONAL USES OF OHIO RIVER. • DESCRIBE THE LEVEL OF USE IN TERMS OF NATIONAL CRITERIA CATEGORIES. • Beach use, moderate use, light use. • DETERMINE WHEN THE USES OCCUR. • Ohio River criteria apply May-Oct.
Scope • Budget set at $100 K. • Additionally requested to obtain fish consumption data if feasible within budget. • Put out RFP and selected proposal using a phone survey approach. • Augmented with field surveys including observations and interviews.
Survey Design • 5102 random telephone surveys completed. • 3,865 inner zone; 1,237 outer zone.
170 Field Surveys285 Interviews • Ground-truth phone survey results. • Sites every 20 miles “randomly” selected. • 4-hour surveys completed 2-3 times at each location during rec season. • Observational counts of recreational activities – Ground Surveys. • In-person interviews – Intercept Surveys.
Are the numbers right & what do they mean? They are all estimates!!!
Extrapolating the Field data • Surveyed 49 public access sites 2-3 times during the rec season. • 4-hour observations & in-person interviews. • Recorded the field of vision and counted recreators. • Extrapolated the data to entire river for entire recreation season.
River-Wide Comparison of Results • Phone Survey Error = 1.37% at 95% Confidence. • Phone Survey = 8.2 million person days • Field Survey = 5.2 million max 2.7 million avg • It appears that the phone survey results may over-estimate reality (possibly by a factor of 2-3).
Why compare results to beach use data? • Comparison to EPA’s criteria language: • Moderate use: At least half use of typical bathing beach. • Light use: Less than half use of typical bathing beach.
10-Mile River Segment Equivalent Area to Beach Use Lake Area
Fish Consumption Data for Inner Zone • Freshwater Fish Consumption Rate 90th percentile Inner Zone population = 37.3 gm per day. • EPA’s national fish default freshwater fish consumption rate 90th percentile general population = 17.5 gm per day. • Ohio River Fish Consumption Rate 90th percentile Inner Zone population = 1.86 gm per day. • 16% of the population consumed some Ohio River fish (6% don’t know). • 35% are aware of consumption advisories. • 29% of those not eating Ohio River fish due to contamination.