Download
1 / 20
200 likes | 319 Views
Marine Resources Program: Ocean Recreational Boat Survey (ORBS). Oregon Dept. of Fish and Wildlife December 2001.

E N D
Marine Resources Program:Ocean Recreational Boat Survey (ORBS) Oregon Dept. of Fish and Wildlife December 2001
Project changes continue: Collection of age structures, length/weight sampling of most bottomfish, samples include information on reef location, and sampling is conducted at Bandon and Port Orford for the first time. Halibut quota management issues develop beginning in 1987, and require increased sampling activity. Ocean Salmon Management Program begins statistical sampling program to estimate catch and effort in the ocean recreational fishery including bottomfish catch and effort during the salmon season. Concerns about accuracy of recreational bottomfish estimates. Series of meetings with NMFS and PSMFC are initiated. Need for change is recognized. Prior to 1979, data was collected in a non-systematic manner. Wholesale changes to the Ocean Salmon Sampling Project begin: Sampling at Gold Beach resumes; overwinter sampling study begins at Depoe Bay, Newport, and Brookings; and other changes are earmarked for evaluation. Project name changed to Ocean Recreational Boat Survey. El Niño of 1983 has disastrous consequences to NW ocean fisheries. In 1984 and 1985, seasons are very restricted, and bottomfish sampling is limited. Integration of ORBS data into RecFin database begins. Ocean Recreational Boat Survey - Historical Timeline 1979 1983 1984 1986 1994 1998 1999 2000
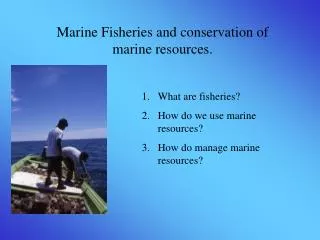
Fisheries and Objectives Ocean Salmon Accurate and timely effort and catch estimates (quotas) by port, catch area, week, and boat type Adequate recovery of coded-wire tags (>20% required by week). Biological sampling: Coho length/weight, chinook lengths, and coho scales from select fish.
Fisheries and Objectives • Pacific Halibut • Accurate and timely effort and catch estimates (quotas) by port, catch area, reef location, week, and boat type. • Lengths are recorded for estimation of biomass of landings.
Fisheries and Objectives • Bottomfish (Rockfish, Lingcod, Cabezon, etc.) • Accurate and timely effort and catch estimates by port, reef location, week, and boat type. • Biological sampling: Age structures for select species and length/weight collection all species.
Fisheries and Objectives • Albacore Tuna • Effort and catch estimates by port, week, and boat type. • Quality of estimates not at same level as for other fisheries, due to behavior of fishery and timing of trips.
Methodology: Effort • Private boats (1): Bar crossing count dawn to 10:00 AM in most ports, with expansion for trips leaving after count. • Private boats (2): Initial trailer and moorage slip count, and track additional launches through day. • Charter boats: Contact charter offices for tally of trips by target species.
Methodology: Interviews • Private boats randomly interviewed throughout the major moorage and launch sites. • Charter boats interviewed usually with prior knowledge of trip type. Sampling conducted without regard to vessel size or passenger load. • Boats interviewed only at the end of their trips, all catch and anglers on a boat are included in an interview.
Methodology: Interviews • Data elements of each interview: • Header info: Sampler ID, date, and port. • Trip info: Catch area, major reef area (bottomfish trips only), departure time, interview time, boat license or name, and number of anglers. • Stratification info: • Fishery (O/E) • Boat type (C/P) • Trip type (S/C/B/H/T/D/N) • Catch info: Number of fish retained by species, released fish by species, CWTs recovered, and Pacific halibut lengths.
Methodology: Interviews • Handheld computers used for most data elements collected. Allows for “trapping” and elimination of many common errors. • Supplemental information attached to interview: • Length/weight data. • Lingcod fin ray data. • Rockfish otolith data.
Stratification of Data Catch Area Strata Catch areas used primarily for salmon management.
Stratification of Data • Port Strata • Major ports: sampling goal for five major ports Mar. 1 - Oct. 31 (covers period when ~96% of activity occurs). • Minor ports: sampled for shorter period (7 minor ports make up ~29.9% of total summer effort, but only ~8% of non-salmon activity). • Limited ocean access sites not sampled (9 sites).
1999 1998 2000 Projected sample period: Mar. 1 - Oct. 31 ~97% Stratification of Data Weekly - Highly variable fisheries require narrow time frames for accurate estimation Boat Type - Charter and private target species vary significantly at times.
Planned Sample Timeframe Structure of ORBS (Sampling Dates Forecast for 2002 and Approximate Pct. Of Annual Non-Salmon Fishing Effort) Jan Feb Mar Apr May Jun Jul Aug Sep Oct Nov Dec 5/1-9/30 ~86% Astoria Five Major Ports Account for: ~ 66% of the Salmon and Combo Anglers ~ 92% of the Bottomfish and Halibut Anglers 3/1-11/15 ~96% Garibaldi 5/1-9/30 ~86% Pacific City 3/1-10/31 ~96% Depoe Bay Newport 3/1-10/31 ~97% Five Minor Ports Account for: ~ 32% of the Salmon and Combo Anglers ~ 5% of the Bottomfish and Halibut Anglers 6/15-9/15 ~56% Florence 5/1-9/30 ~86% Winchester Bay Two Minor Ports Account for: ~ 2% of the Salmon and Combo Anglers ~ 3% of the Bottomfish and Halibut Anglers 3/1-10/31 ~96% Charleston 5/1-9/30 ~80% Bandon 5/1-10/31 ~90% Port Orford 5/1-9/30 ~80% Gold Beach 3/1-10/31 ~96% Brookings
Project Structure • Two biologists oversee project • One project leader oversees data services including processing of data and handheld software development • One data support position currently handles data entry • Two crew leaders assist in field supervision and transfer of data • In 2001, seasonal staffing included: • Biological sampling coordinator - 1 • Port samplers - 22 • At sea fishery observers - 4
Project Facts • Samplers interviewed an average of 14,411 private boats and 3,126 charter boats over the past five years. • Expenditures for seasonal employees and associated costs in 2001 totaled $470,000. • Sampling rates vary substantially by port, but have averaged 53% for charters and 41% for private boats over the past five years.
Products and Timelines • Catch and effort data • In-season preliminary catch and effort estimates available within four days after the end of the week. • Completed “wave” estimates for in-season upload to RecFIN available within 2-4 weeks of the end of “wave”. • “Finalized” data set available by mid-January. • Coded Wire Tags • Preliminary completed by mid-January following the season. • Finalized data set available by end of year following season.
ORBS Goals • Meet fishery management needs of PFMC and Oregon by providing accurate, appropriate, and timely catch and effort estimates of the ocean recreational boat fishery.