Download
1 / 12
120 likes | 237 Views
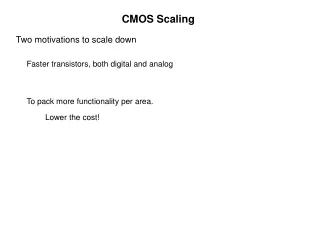
Semantic Scaling. Ken Homa. Semantic Scaling Research Illustration. How sweet is your ideal cola ? How important is it to you that a cola have the proper sweetness ? How closely does brand X match to your ideal sweetness ?. Very=4 Somewhat=3 Not much=2 Not at all=1.

E N D
Semantic Scaling Ken Homa
Semantic ScalingResearch Illustration • How sweet is your ideal cola ? • How important is it to you that a cola have the proper sweetness ? • How closely does brand X match to your ideal sweetness ? Very=4 Somewhat=3 Not much=2 Not at all=1
Semantic Scaling • Large samples (typically)Survey-based methodology • A priori selection of attributesUnimportant attributes get low ratingsImportant attributes may be overlooked overlooked • Limited rating scaleConstrained upper & lower ratingsGradients may not adequately differentiateImplicitly assumes linear relationships • (Relatively) easy understand & apply
Conventional MappingSnake Chart Does notDescribes it describecompletely it at all | | | | | | 0 1 2 3 4 5 1. Company provides adequate insurance coverage for my car. 2. Company will not cancel policy because of age, accident experience, or health problems. 3. Friendly and considerate. 4. Settles claims fairly. 5. Inefficient, hard to deal with. 6. Provides good advice about types and amounts of coverage to buy. 7. Too big to care about individual customers. 8. Explains things clearly. 9. Premium rates are lower than most companies. 10. Has personnel available for questions all over the country. 11. Will raise premiums because of age. 12. Takes a long time to settle a claim. 13. Very professional/modern. 14. Specialists in serving my local area. 15. Quick, reliable service, easily accessible. 16. A “good citizen” in community. 17. Has complete line of insurance products available. 18. Is widely known “name company”. 19. Is very aggressive, rapidly growing company. 20. Provides advice on how to avoid accidents.
Perceptual Map High Price E A G D C B Low Quality High Quality F Low Price
Perceptual Map High Price VALUE E A G D C B Low Quality High Quality F Low Price
Perceptual Map High Price E A G D C B Low Quality High Quality F Low Price
Preference Models • Ideal points (individuals) • Clusters (segments) • Proximity (preference)
Perceptual Map High Price E A G D 2 3 C B Low Quality High Quality 1 F Low Price
Ideal PointsIn general ... • Most of a brand’s sales will come from the segments with the closest ideal points • Most of a segment’s sales (share) will go to the brands closest to its ideal point
A A A B B B Targeting Strategies 1 • Direct hit … single product ‘right on’ • Bracketingmultiple products ‘surround’ • “Tweeners”single product ‘splitting the difference’ to induce a new segmentation 2 3 3