Download
1 / 12
200 likes | 529 Views
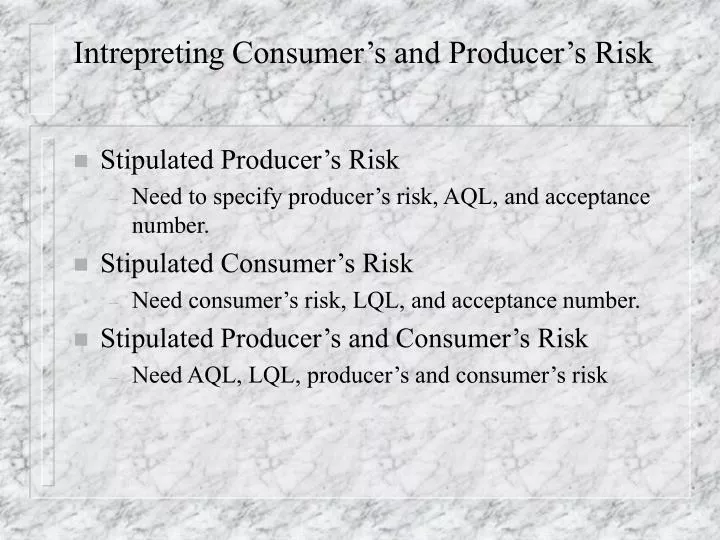
Intrepreting Consumer’s and Producer’s Risk. Stipulated Producer’s Risk Need to specify producer’s risk, AQL, and acceptance number. Stipulated Consumer’s Risk Need consumer’s risk, LQL, and acceptance number. Stipulated Producer’s and Consumer’s Risk

E N D
Intrepreting Consumer’s and Producer’s Risk • Stipulated Producer’s Risk • Need to specify producer’s risk, AQL, and acceptance number. • Stipulated Consumer’s Risk • Need consumer’s risk, LQL, and acceptance number. • Stipulated Producer’s and Consumer’s Risk • Need AQL, LQL, producer’s and consumer’s risk
Choosing an (n,c) plan • Stipulating Producer’s Risk • Set PR = desired alpha (.05 in our example) AQL = .015 and choose c: • For c = 1, Table G shows np = 0.355. • We know p (= AQL = .015) so solve for n • n = 0.355/.015 = 23.67 = 24. So desired plan is (24, 1) • Can duplicate this for any c. • What is consumer’s risk for this plan? • LQL = .08; n = 24; λ = (24)(.08) = 1.92 ~ 1.9 • CR = Pa = .434 (not too good)
Choosing an (n,c) plan • Stipulating Consumer’s Risk • Set CR = desired beta (.10 in our example), • LQL = .08 and choose c: • For c = 3, np = 6.681. • p = .08, n = 6.681/.08 = 83.51 = 84 • (n, c) plan = (84, 3) • What is producer’s risk for this plan (AQL = .018)? • n = 84, p = .018, λ = 1.532 ~ 1.5 • Pa = .934, Prod Risk = 1 – Pa = .066. Pretty good!
Stipulated Producer’s AND Consumer’s Risk • For the same parameters above (AQL = .018, LQL = .08) assume that we want PR = 5% and CR = 10%, what is the least n that satisfies this? • np2/np1 = LQL/AQL = .09/.018 = 5.00 • Look this number up on Table G. • Doesn’t appear, so try closest, which are c = 2 (6.51) and c = 3 (4.89, probably better because closer!) • Stipulate which (PR or CR) you want to be exact. • See which of the four possibilities you are happiest with (closest fit)
Set PR = .05, c = 2: • np = 0.818 (from Table G), p = .018 => n = 44.45 = 45 (round up for conservatism), => (45,2) • What is CR? λ = np = 45*.09 = 4.15 ~ .21 (using interpolation) • Choose c = 3 • np = 1.366, p = .018 => n = 75.88 = 76 =>(76,3) • CR? λ = np = 76*.09 = 6.84 ~ 0.9 (better!) • Can do the exact same procedure simply setting consumer’s risk exactly and solving for producer’s risk. Then decide which is best. • Why are we not surprised that (76, 3) has a lower CR than (45, 2)?
Challenge Problem • In the previous example, assume the defective (p = 6%) batches occur, on average, only 30 times/year (out of 300 plant operating days) and that on a given day the sample of 50 shows 4 defects and is rejected. What is the probability that this batch is really ok (type II error)?
Selecting a Sampling Plan: Approach • Use the Military Standard or ANSI/ASQC Z1.4 Plans • AQL • Level of Inspection (I,II,III,S1,S2,S3,S4) • Inspection severity (normal, tightened, reduced) • Single or multiple sampling • Dodge-Romig plan based on LQL. Need to know the • average p of nonconforming lots based on recent data. • this is closest to the approach which will now be • discussed.
Pa p p Selecting a Sampling Plan: Let’s make a decision! • Use Economic Model with Optimization • Calculate total cost given p, n and c • Using a prob. distribution of p, find expected cost given n and c • Choose n and c to minimize total expected cost
Approach #3: Economic Model for Rectifying Sampling Total Cost = Inspection cost + cost of undetected defects Expected total cost =
Let’s make a decision! • Talco supplies ships lots of 1000 transistors to the US government. Some of the time (P-good) the proportion defective is 5%, which is acceptable, given the low labor rate that Talco charges. Otherwise (P-bad),the defect rate = .10, for which Talco must pay a penalty of Rs1500. It costs Talco Rs 1 per inspection. • If it is equally likely that p = .05 as .10, should Talco inspect all or not? (no sampling available) • At what value of P-bad would Talco be indifferent between 100% inspection, and no inspection?
Let’s make a decision (with sampling)! • Would a sample help us? How? What does the sample give us? • Suppose Talco took a sample of 20, and found 2 defective parts, should they accept or reject the lot? • Is this answer invariant of the prior probability of good lots vs. bad lots? • If n were set at 20, what would be the optimal (n, c) plan?
Summary • Sampling can be helpful in many ways. • It’s not easy to figure out what kind of sampling plan to use or when it’s helpful. • What do we need to know: important factors