Download
1 / 65
650 likes | 766 Views
Dezső Sima Fall 2006. 2. A New Era in Processor Evolution. D. Sima, 2006. Contents. 1. Processor performance. 2. Efficiency of processors. 3. Addressing the leveling off of processor efficiency. 4. Aggressively raising clock frequency. 5. The efficiency wall. 6. The thermal wall.

E N D
Dezső Sima Fall 2006 2. A New Era in Processor Evolution D. Sima, 2006
Contents 1. Processor performance 2. Efficiency of processors 3. Addressing the leveling off of processor efficiency 4. Aggressively raising clock frequency 5. The efficiency wall 6. The thermal wall 7. The skew wall 8. EPIC architectures/processors 9. The end of an era in processor evolution
1. Processor performance 1.1. Introduction (1) Relative performance Absolute performance Number of succesfully executed instructions/sec Relating the execution times of a benchmark program on the tested system to a reference system according to the following interpretation: Number of succesfully executed operations/sec (SIMD) fc: Clock frequency IPC: Instructions/cycle OPI: Operations/cycle E.g.: SPECint92, SPECint_base2000
1.1. Introduction (2) In general purpose applications: where: IPC : issued instructions per cycle η : number of successfully executed/issued instructions (efficiency of the speculative execution)
1.1. Introduction (3) In performance/efficiency studies: Theoretical interpretation: Pa Practical measurement: Pr ?
1.1. Introduction (4) If the following were true: In that case: I: Number of instructions in the application considered
1.1. Introduction (5) However: Figure 1.1.: Runtime ratios of the component programs of SPECint2000 Source: http://www.spec.org
1.1. Introduction (6) When comparing the performance of two systems: This estimation is useable in trend considerations.
1.1. Introduction (7) Comparing the efficiency of two systems:
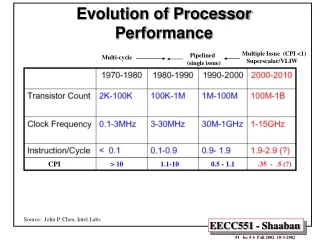
1.2. Evolution of processor performance (1) Figure 1.2: Integer performance growth of Intel’s x86 processors
1.2. Evolution of processor performance (2) Figure 1.3: Integer performance growth (in general - 1) Source: X86-64 Technology White Paper, AMD Inc., Sunnyvale, CA, 2000
1.2. Evolution of processor performance (3) 3. Figure 1.4: Integer performance growth (in general - 2) Source: F. Labonte, www-vlsi.stanford.edu/group/chart/specInf2000.pdf
2. Efficiency of processors 2.1. Introduction ?
2.2. Growth of processor efficiency (1) Figure 2.1: Efficiency of Intel processors
2.2. Growth of processor efficiency (2) Figure 2.2: Growth of processor performance/efficiency (in general) Source: J. Birnbaum, „Architecture at HP: Two decades of Innovation”, Microprocessor Forum, October 14, 1997.
2.3. Contribution of raising processor efficiency to the growth of processor performance (up to the 2nd generation of superscalars) ? A második generációig az órafrekvencia és a hatékonyság növelése egyenlő arányban járultak hozzá a teljesítmény növeléséhez.
2.4. Sources of raising processor efficiency Increasing the word length 8/16 32 bit (286 386DX) Introducing and increasing temporal parallelism 1st and 2nd generation pipeline processors (386DX, 486DX) Introducing and increasing issue parallelism 1st and 2nd generation superscalars (Pentium, Pentium Pro)
2.5. Limit of raising processor efficiency (1) 2nd generationsuperscalars(wide superscalars) Processing width 4 RISC instructions/cycle ~3 CISC instructions/cycle Source: Wall: Limits of ILP, WRL TN-15, Dec. 1990 Figure 2.3: Processing width of 2nd generation (wide) superscalars vs extent of parallelism available in general purpose applications
2.5. Limit of raising processor efficiency (2) Figure 2.4: Growth of processor efficiency (in general)
2.5. Limit of raising processor efficiency (3) In general purpose applications: The width of 2nd generation superscalars already approaches the extent of available parallelism (ILP) Beginning with 2nd generation (wide) superscalarsthe sources of extensively raising processor efficiency became exhausted
3. Addressing the leveling off of processor efficiency Essentially widening the core by introducing EPIC architectures Aggresively raising clock frequency (Sections 4 – 7) (Section 8) Main road of evolution
4. Aggressively raising clock frequency 4.1. Sources of raising clock frequencies (1) Raising clock frequency By scaling down the feature size in the manufacturing process By reducing the logic depth of pipline stages
4.1. Sources of raising clock frequencies (2) Figure 4.1: Evolution of Intel’s process technology Source: D. Bhandarkar: „The Dawn of a New Era”, 11. EMEA, May, 2006.
No of pipeline stages 40 P4 Prescott (~30) 30 * Pentium 4 (~20) Core Duo 20 * Conroe Pentium Pro Athlon-64 (14) (~12) (12) Athlon * Pentium K6 * * (6) 10 (6) (5) * * * Year 1995 2005 2000 1990 4.1. Sources of raising clock frequencies (3) Figure 4.2: Number of pipeline stages in Intel’s and AMD’s processors
4.1. Sources of raising clock frequencies (4) Figure 4.3: Max. logic depth of pipeline stages in processors (in terms of FO4) Source: F. Labonte www-vlsi.stanford.edu/group/chart/CycleFO4.pdf
4.2. Growth rate of clock frequencies (1) Figure 4.4: Growth of clock frequencies in Intel’s x86 line of processors
4.2. Growth rate of clock frequencies (2) Figure 4.5: Growth of clock frequencies (in general)
4.3. Implications of aggressively raising clock frequencies 4.3.1 Overview Ousting of major RISC families (4.3.2) Emerging limits of evolution (4.3.3)
4.3.2. Ousting of major RISC families (2) Figure 4.6: The shift in performace leadership between RISC and x86 lines
4.3.2. Ousting of major RISC families (2) 1995-2000: CISCs overtook the performance leadershipthen it is a more intrinsic task to raise fc from a higher value than from a lower one in the same rate 1997: Intel and HP unveiled IA-64/Merced as the next generation architecture/processor line Cancelling of most major RISC lines, such as MIPS’s R-Lines, HP’s Alpha and PA lines, PowerPC Consortium’s PowerPC line
4.3.3. Emerging limits of evolution The efficiency wall (Section 5) The thermal wall (Section 6) The skew wall (Section 7)
5. The efficiency wall 5.1. Overview Basic reason: speed gap between the processor and the memory (widens on higher frequencies)
5.1. Overview (2) Main appearances of the speed gap between the processor and the memory: DRAM latencies Memory transfer rates L2 cache latencies Transfer rates of processor buses
5.2. Speed gap between processor and memory (1) Figure 5.1: Latency of DRAM chips (in clock cycles)
5.2. Speed gap between processor and memory (2) Figure 5.2: Relative transfer rate of memories (D: dual channel)
5.2. Speed gap between processor and memory (3) Figure 5.3: Latency of L2 caches
5.2. Speed gap between processor and memory (4) Figure 5.4: Relative transfer rates of processor buses
5.3. Efficiency of 3rd generation superscalars (1) 5.5: Efficiency of Intel’s Pentium III and Pentium 4 processors in general purpose applications
5.3. Efficiency of 3rd generation superscalars (2) Figure 5.6: efficiency of AMD’s Athlon, Athlon XP and Athlon 64 processors in general purpose applications
5.3. Efficiency of 3rd generation superscalars (3) Figure 5.7: Main aspects of the memory subsystem affecting core efficiency
5.3. Efficiency of 3rd generation superscalars (4) Figure 5.8: Contrasting the efficiency of Intel’s and AMD’s processors
5.3. Efficiency of 3rd generation superscalars (5) Figure 5.9: Contrasting Intel’s and AMD’s processor design philosophies
5.3. Efficiency of 3rd generation superscalars (6) Implication of the emerging efficiency wall: Diminishing return on higher clock frequencies
6. The thermal wall (1) Dissipation (D) : Dynamic Static Ds=V*Ileak Dd=A*C*V2*fc with A: ratio of the active gates C: effective capacity of the gates V: supply voltage fc: clock frequency Ileak: leakage current
6. The thermal wall (2) Figure 6.1:Chip dynamic and static power dissipation trends Source: N. S. Kim et al., „Leakage Current: Moore’s Law Meets Static Power”, Computer, Dec. 2003, pp. 68-75.
6. The thermal wall (3) Figure 6.2: Relative dissipation of Intel’s x86 family of processors
6. The thermal wall (4) Figure 6.3: Contrasting the evolution of Intel’s and AMD’s processor lines with the thermal wall
6. The thermal wall (5) Figure 6.4: Intel’s P4 processor family (Netburst architecture)
6. The thermal wall (6) Figure 6.5: The growth of relative dissipation of processors (in general) Source: R Hetherington, „The UltraSPARC T1 Processor” White Paper, Sun Inc., 2005
6. The thermal wall (7) Implications of the thermal wall: The approach to increase performance by aggressively raising clock frequency met the thermal wall Processor designs focus now more and more on power aware technics