Download
1 / 13
130 likes | 222 Views
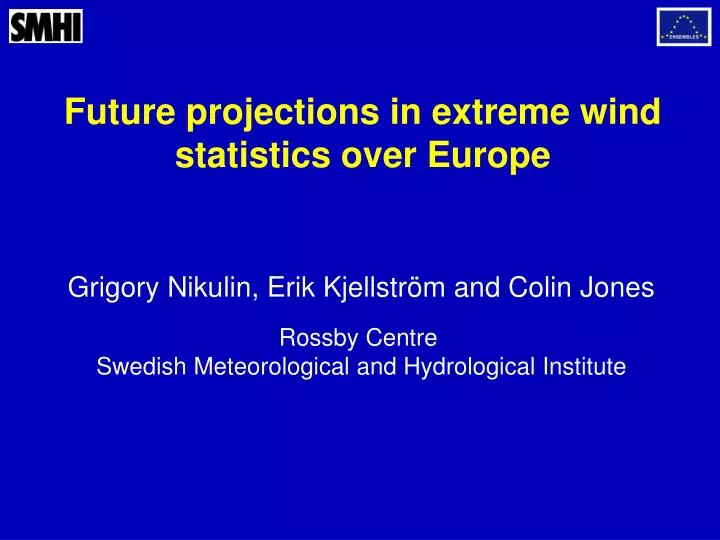
Future projections in extreme wind statistics over Europe. Grigory Nikulin, Erik Kjellström and Colin Jones Rossby Centre Swedish Meteorological and Hydrological Institute. Objectives.

E N D
Future projections in extreme wind statistics over Europe Grigory Nikulin, Erik Kjellström and Colin Jones Rossby Centre Swedish Meteorological and Hydrological Institute
Objectives Starting point: regional climate projections in wind extremes is much more sensitive to driving GCMs than temperature and precipitation extremes (Nikulin et al., Tellus A 2011) • What is our confidence is the projected climate change in wind extremes compared to temperature and precipitation extremes ? • Sources of uncertainties in regional projections: different driving GCMs different RCMs natural variability
Ensembles of simulations One RCM driven by different GCMs RCM: RCA3, SMHI (50 km) GCMs: ECHAM5-r3 (MPI, Germany) HadCM3-ref (MOHC, UK) BCM (NERSC, Norway) CCSM3 (NCAR, USA) CNRM (CNRM, France) IPSL (IPSL, France) Different RCMs driven by one GCM RCMs: RCA3, SMHI; RACMO, KNMI; REMO, MPI; (25 km) GCM: ECHAM5-r3, MPI Natural variability - one RCM driven by one GCM with different initial conditions RCM: RCA3, SMHI (50 km) GCMs: ECHAM5 (3 members: r1, r2, r3)
Data and method daily max 10m gust wind Extreme events the 50-year return values of winter (October-March) maximum gust wind; the generalised extreme value (GEV) distribution fitting the GEV: stationary model, L-moments 30-yr time slices: 1961-1990, 2011-2040, 2041-2070, 2071-2100 30-yr moving GEV 1961-2100 (gust wind averaged over a region) Confidence intervals parametric bootstrap
Projected change in warm extremes Moving GEV: 50yr ret. val. of T2max (ONDJFM ) role of driving GCMs common gradual increase
Climate change in precipitation extremes Moving GEV: 50yr ret. val. of winter max precipitation role of driving GCMs a tendency to intensification of precipitation extremes
Climate change in wind extremes • strengthening of extreme gust winds over the Barents Sea (reduction in sea ice ) • a tendency to strengthening of wind extremes over the Baltic Sea • large spread among the simulations (magnitude, spatial patterns)
Climate change in wind extremes Moving GEV: 50yr ret. val. of winter (ONDJFM) max gust wind role of driving GCMs diverse behaviour of individual projections no common gradual increase; large decadal variability
Climate change in wind extremes role of natural variability: one driving ECHAM5 with different initial conditions some tendency to an increase in wind extremes 2071-2100 natural variability or forced signal ?
Climate change in wind extremes Moving GEV: 50yr ret. val. of winter (ONDJFM) max gust wind role of natural variability r2-3 show a large increase from 2060 but a small increase for r1 only natural variability or forced signal masked by natural variability ? Are 3 members enough to conclude ?
Climate change in wind extremes Different RCMs RCA3 RACMO2 REMO some similarities between RCA3 and REMO noisy patterns for RACMO2
Climate change in wind extremes Moving GEV: 20yr ret. val. of winter max gust wind – (1975-2000) different RCMs difference in magnitude; time series are often not "synchronized";
Conclusions Projected changes in Wind Extremes Driving GCMsvery critically define the projected regional change in wind extremes: different magnitudes, diverse spatial patterns Natural variability is very large and can easily mask the forced signal; 3 members with different initial conditions may not be enough to separate natural and forced signals RCMs:different parameterization of gust wind and internal RCM dynamics show a spread among the results comparable to the spread related to natural variability