Download
1 / 55
550 likes | 666 Views
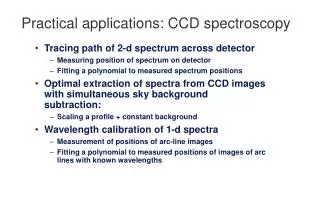
Recent Practical Applications Using Radiance. 2003 Radiance Workshop Matt Franks, Arup Lighting Andrew McNeil, Arup Lighting. Overview. California Academy of Science – San Francisco, CA Skylight geometry opimization Historical weather data

E N D
Recent Practical Applications Using Radiance • 2003 Radiance Workshop • Matt Franks, Arup Lighting • Andrew McNeil, Arup Lighting
Overview • California Academy of Science – San Francisco, CA • Skylight geometry opimization • Historical weather data • Battersea Power Station Residential Development – London, UK • Code compliance analysis • “Modular” modeling process • Acoustical Reflector Analysis • Using Radiance for geometrical studies of reflector coverage
The California Academy of Sciences Coral Reef Studies
Project Overview • Rain Forest • Planetarium
N Project Overview • Coral Reef
Objectives • Objectives • Maximize direct sun on the coral reef. • Minimize solar heat gain (reduce skylight glazing) • Tasks • Identify where skylights should be located to maximize direct solar radiation. • Quantify hours of direct solar radiation on the coral reef.
Determining “Effective” Skylight Placement. • Method #1 – Assign luminance values to sky based on probability of sun. FAILED • Method #2 – Trace rays in direction of sun for a Yes/No response. SUCCESS
Method #1 • Step 1 Luminance values were assigned to the sky based on the number of hours the sky was in each segment (we used 360 x 180 segements).
Method #1 Sky • Step 2 • A grid was defined on the roof. • A point in the center of the coral reef was designated as the origin point. Grid Roof Reef
Method #1 Sky • Step 3 • A direction is calculated for each grid point using the point and the reef “origin.” • That direction is used to test the sky. A value equal to the number of hours the sun spends in that portion of the sky is returned. Grid Roof Reef
Method #1 • Result Amount of sun (in hours) that from a given point on the roof that lands on the coral reef “origin” per year.
Method #1 Method #1 failed because: • It only accounted for sun landing on one point of the coral reef. • The generated sky seemed to be skewed towards the solstices. These problems might have been overcome, but a better method came to us.
Method #2 Sky • Step 1 Assign a glow material to the surface of the coral reef. • Step 2 Trace a ray from the roof grid downwards in the direction of the the sun for every hour of the year. Grid Roof Reef
Method #2 • Result The entire reef is considered instead of just one point. Amount of sun (in hours) that from a given point on the roof that lands on the coral reef per year.
Initial Skylight Configuration • Original skylight configuration (shaded areas are skylights).
Initial Skylight Configuration • Hours of direct sun on coral reef per year (during a completely sunny year).
Revised Skylight Configuration • Revised skylight configuration (shaded areas are skylights).
Revised Skylight Configuration • Hours of direct sun on coral reef per year (during a completely sunny year).
Revised Skylight Configuration • Solar Gain Reduced by more than 70% (considering skylights associated with coral reef) • Hours of direct sunlight reduced by only 33%
Incorporating Weather Data • What good is data from a “completely sunny year?” • It provides a basis for comparison • Dosen’t help to understand actual performance. • SAMSON Data (has solar and sky radiation data) • Hourly data integrates well with hourly analysis!
Incorporating Weather Data • Hours of direct sun on coral reef during 1990.
Incorporating Weather Data • Average hours of direct sun on coral reef by month during 1990.
Pictures • Perspective image of grid & roof.
Pictures • Daylight factor on planetarium dome.
Pictures • Rendering of coral reef area from piazza.
Pictures • Rendering through rainforest (translucent dome).
Pictures • Rendering of building entrance.
Battersea Power Station Residental Development • Three apartment blocks as part of a larger redevelopment • London, UK • British Standard - BS 8206-2 • Lighting For Buildings – Part 2: Code of Practice for Daylighting • Goal: Determine compliance with the standard
Model Detail • Early study • Very simplified model • Assumptions for materials • Not included: • Façade screen • Surrounding buildings
Goals • Determine compliance with British Standard for Daylighting • Step 1 – Determine “worst case” apartments • Step 2 – Calculate daylight factor in “worst case” apartments • Step 3 – Produce “Compliance Contours” • Step 4 – Determine percentage possible sunlight in “worst case” apartments
50% 40% 30% 20% 10% 10% Step 1 – Determine “Worst Case” Apartments • Daylight factor distribution on each façade • Overcast sky model
Step 2 – Calculate D. F. in “Worst Case” Apartments • Model built as simple blocks (no interior) • Use mkillum to “capture” daylight distribution landing on façade
Apartment B Apartment A Step 2 – Calculate D. F. in “Worst Case” Apartments • Apply mkillum distribution to individual apartment model • 1 model – many possible distributions • Hand edited mkillum output
1 2 1 2 3 3 Step 2 – Calculate D. F. in “Worst Case” Apartments Apartment A Apartment B
Step 3 – Produce “Compliance Contours” • Determine relationship between daylight factor on façade and daylight factor in apartment • Bedroom: 1% minimum average d.f. • Living Room: 1.5% minimum average d.f.
Apartment B Apartment A Step 4 – Percentage possible sunlight • Calculated for balcony area only • Simplified model using monthly probabilities • Minimum 25% possible hours
Apartment B Apartment A 337(21%) 312(20%) 277(18%) 229(15%) 189(12%) 0(0%) Step 4 – Percentage possible sunlight
Acoustical Reflector Analysis • Problem • Need method to show patterns of acoustical reflector coverage in a 3D model • Apparently no available acoustical software to do this • Why use Radiance? • Easy to model complex spaces • Acoustical reflections similar to light reflections • Ability to change image generating parameters • Material properties • Exposure • Combining images
Early development of process • First try – not very successful • Acoustical source modeled as light source • Acoustical reflectors modeled as mirrors (colored) • Single model, single rendering • Visibility of reflected patches was a problem • Second try – split renderings and combine later • More control over exposure • More post-processing options • More flexible
Acoustical source – small “light” sphere Acoustical reflector – colored “mirror” with substituted plastic Floor, walls, ceiling – plastic Simple test room
Red Reflector Image • Right reflector as red mirror • Left reflector as grey plastic • Viewpoint just in front of source
Blue Reflector Image • Right reflector as grey plastic • Left reflector as blue mirror • Viewpoint just in front of source
Diffuse Image • Right reflector as red plastic • Left reflector as blue plastic • Viewpoint just in front of source • Same light source
Subtract Ambient Light • Leaves only reflected patches
Add Patches to Diffuse Image • Visualization of reflector coverage in 3D space
Next Steps • More complex model • More reflectors • More colors • Limitations • Reflectors should be smooth, not faceted • Limited number of colors • More colors makes a more complicated process for adding/subtracting images