Download
1 / 25
250 likes | 392 Views
Lecture 9: Introduction to Genetic Drift. February 14, 2014. Exam to be returned Monday Mid-term course evaluation Class participation Office hours. Announcements. Last Time. Overdominance and Underdominance Overview of advanced topics in selection Introduction to Genetic Drift.

E N D
Lecture 9: Introduction to Genetic Drift February 14, 2014
Exam to be returned Monday Mid-term course evaluation Class participation Office hours Announcements
Last Time • Overdominance and Underdominance • Overview of advanced topics in selection • Introduction to Genetic Drift
First in-class simulation of population genetics processes: drift Fisher-Wright model of genetic drift Today
Mutation Drift + - + +/- Selection Migration What Controls Genetic Diversity Within Populations? 4 major evolutionary forces Diversity
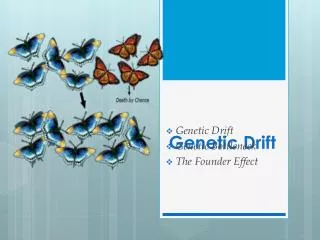
Genetic Drift • Relaxing another assumption: infinite populations • Genetic drift is a consequence of having small populations • Definition: chance changes in allele frequency that result from the sampling of gametes from generation to generation in a finite population • Assume (for now) Hardy-Weinberg conditions • Random mating • No selection, mutation, or gene flow
m m m m m m m m m m m m m m Drift Simulation • Pick 1 red and 3 other m&m’s so that all 4 have different colors • Form two diploid ‘genotypes’ as you wish • Flip a coin to make 2 offspring • Draw allele from Parent 1: if ‘heads’ get another m&m with the same color as the left ‘allele’, if ‘tails’ get one with the color of the right ‘allele’ • Draw allele from Parent 2 in the same way • ‘Mate’ offspring and repeat for 3 more generations • Report frequency of red ‘allele’ in last generation Parent 2 Parent 1 m m m heads tails m m m
Genetic Drift A sampling problem: some alleles lost by random chance due to sampling "error" during reproduction
Simple Model of Genetic Drift • Many independent subpopulations • Subpopulations are of constant size • Random mating within subpopulations N=16 N=16 N=16 N=16 N=16 N=16 N=16 N=16 N=16 N=16 N=16 N=16 N=16 N=16 N=16 N=16 N=16 N=16 N=16 N=16 N=16 N=16 N=16 N=16 N=16 N=16 N=16 N=16 N=16 N=16 N=16 N=16 N=16 N=16 N=16 N=16 N=16 N=16 N=16 N=16 N=16 N=16 N=16 N=16 N=16 N=16 N=16 N=16 N=16 N=16
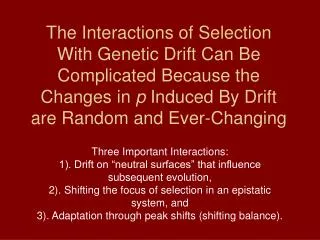
Key Points about Genetic Drift • Effects within subpopulations vs effects in overall population (combining subpopulations) • Average outcome of drift within subpopulations depends on initial allele frequencies • Drift affects the efficiency of selection • Drift is one of the primary driving forces in evolution
Effects of Drift • Random changes through time • Fixation or loss of alleles • Little change in mean frequency • Increased variance among subpopulations Simulation of 4 subpopulations with 20 individuals, 2 alleles
How Does Drift Affect the Variance of Allele Frequencies Within Subpopulations?
Effects of Drift http://www.cas.vanderbilt.edu/bsci111b/drosophila/flies-eyes-phenotypes.jpg • Buri (1956) followed change in eye color allele (bw75) • Codominant, neutral • 107 populations • 16 flies per subpopulation • Followed for 19 generations
Modeling Drift as a Markov Chain • Like the m & m simulation, but analytical rather than empirical • Simulate large number of populations with two diploid individuals, p=0.5 • Simulate transition to next generation based on binomial sampling probability (see text and lab manual)
Effects of Drift Across Subpopulations • Frequency of eye color allele did not change much • Variance among subpopulations increased markedly
Fixation or Loss of Alleles • Once an allele is lost or fixed, the population does not change (what are the assumptions?) • This is called an “absorbing state” • Long-term consequences for genetic diversity 44
Probability of Fixation of an allele within a subpopulation Depends upon Initial Allele Frequency where u(q) is probability of a subpopulation to be fixed for allele A2 q0=0.5 N=20 N=20
Effects of Drift on Heterozygosity • Can think of genetic drift as random selection of alleles from a group of FINITE populations • Example: One locus and two alleles in a forest of 20 trees determines color of fruit • Probability of homozygotes in next generation? Prior Inbreeding
Drift and Heterozygosity • Expressing previous equation in terms of heterozygosity: • Heterozygosity declines over time in subpopulations • Change is inversely proportional to population size p and q are stable through time across subpopulations, so 2pq is the same on both sides of equation: cancels • Remembering:
Time for an Allele to Become Fixed • Using the Diffusion Approximation to model drift • Assume ‘random walk’ of allele frequencies behaves like directional diffusion: heat through a metal rod • Yields simple and intuitive equation for predicting time to fixation: • Time to fixation is linear function of population size and inversely associated with allele frequency
Time for a New Mutant to Become Fixed • Assume new mutant occurs at frequency of 1/2N • ln(1-p) ≈ -p for small p • 1-p ≈ 1 for small p • Expected time to fixation for a new mutant is 4 times the population size!
Effects of Drift • Within subpopulations • Changes allele frequencies • Degrades diversity • Reduces variance of allele frequencies (makes frequencies more unequal) • Does not cause deviations from HWE • Among subpopulations (if there are many) • Does NOT change allele frequencies • Does NOT degrade diversity • Increases variance in allele frequencies • Causes a deficiency of heterozygotes compared to Hardy-Weinberg expectations (if the existence of subpopulations is ignored = Wahlund Effect)