Download
1 / 14
140 likes | 262 Views
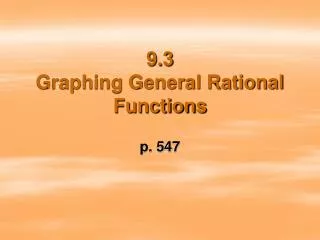
Graphing General Rational Functions. Notes 27 – Section 8.3. Essential Learnings. Students will understand and be able to graph and identify the transformations of rational functions.

E N D
Graphing General Rational Functions Notes 27 – Section 8.3
EssentialLearnings • Students will understand and be able to graph and identify the transformations of rational functions. • Students will understand the relationship between the coefficients of the function and the characteristics of the graphs. • Students will be able to determine the domain and range for rational functions.
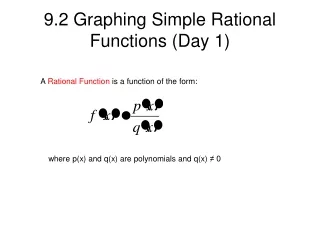
Graphs of Rational Functions Let p(x) and q(x) be polynomials with no common factors other than 1. m is the degree of p(x) n is the degree of q(x)
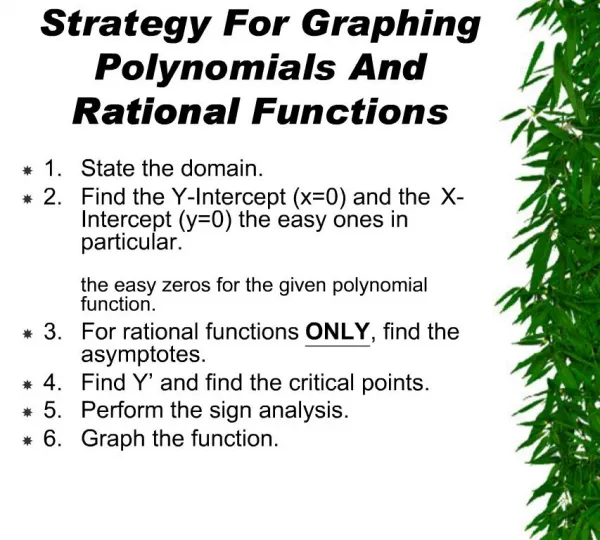
Characteristics 1. The x-intercepts of the graph of f(x) are the real zeros of p(x). 2. The graph of f(x) has a vertical asymptote at each real zero of q(x). 3. The graph of f(x) has at most one horizontal asymptote, which is determined by the degrees m andn of p(x) and q(x).
Horizontal Asymptotes m < n is the horizontal asymptote m = n is the horizontal asymptote m > n No horizontal asymptote, it has an oblique asymptote. Use synthetic division.
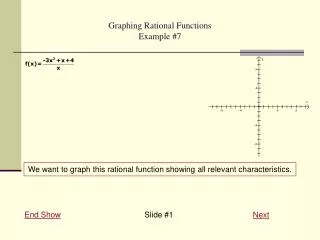
Example 1 – Graph: x y x-intercept: none Hor. asymptote: m < n y = 0 Vert. asymptote: x2 + 4 = 0 x2 = -4 No vert. asymp.
Example 1 cont. x-int: none Hor. asymp: y = 0 Vert. asymp: none Domain: Range:
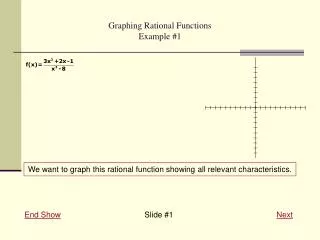
Example 2 – Graph: x y • x-intercept: x2 - 9 = 0 • x2 = 9 • x = 3, (3,0) (-3, 0) Hor. asymptote: m = n y = 1 Vert. asymptote: x2 - 4 = 0 x2 = 4 x = 2, x = -2
Example 2 cont. • x-intercept: (3,0) (-3, 0) Hor. asymp: y = 1 Vert. asymp: x = 2, x = -2 Domain: Range:
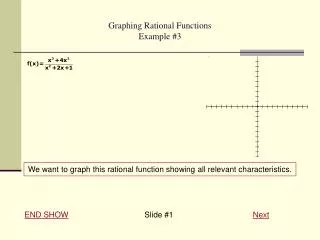
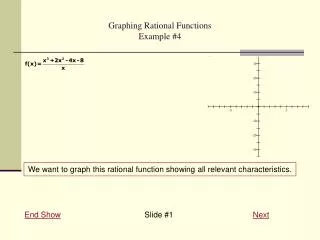
Example 3 – Graph: x y • x-int: x2 - 2x - 3 = 0 • (x – 3)(x+1) = 0 • x = 3, x = -1 (3,0) (-1, 0) Vert. asymp: x + 2 = 0 x = -2 Hor. asymp: m > n none -2 1 -2 -3 End behavior: y = x - 4
Example 3 cont. • x-int: (3,0) (-1, 0) Vert. asymp: x = -2 Hor. asymp: none End behavior: y = x - 4 Domain: Range:
Example 4 – Graph: x y • x-int: x3 - 8 = 0 • x3 = 8 • x = 2 Vert. asymp: 2x2 = 0 x = 0 (2,0) Hor. asymp: m > n none End behavior: (can’t divide) y = ½ x
Example 4 cont. • x-int: (2,0) Vert. asymp: x = 0 Hor. asymp: none End behavior: y = ½ x Domain:
Assignment p. 568: 3 – 5, 7 – 12, 15 – 21 (odd) ** Note change from info on note sheet ALL Late Work Must be Turned in by 3:10 p.m. on Monday, May 13 No Late Work will be accepted after May 13. Unit Study Guide – Due 5/20-21