Download
1 / 29
290 likes | 403 Views
Comparison of the Unified Model Version 5.3 on Various Platforms. Zoe Chaplin 11 September 2003 CAS2K3. Why am I talking about the UM?. Why am I talking about the UM?. SVE consists of CSAR (HPC group), MVC (Visualisation) and eScience

E N D
Comparison of the Unified Model Version 5.3 on Various Platforms Zoe Chaplin 11 September 2003 CAS2K3
Why am I talking about the UM? • SVE consists of CSAR (HPC group), MVC (Visualisation) and eScience • CSAR has 512 processor Origin 3000, 816 processor Cray T3E and is getting a 256 processor Altix Itanium • Many academic users of the UM based throughout the UK using the CSAR service (UGAMP – The UK Universities Global Atmospheric Modelling Group) • Links between Manchester Computing and the Met Office Supercomputing, Visualization & eScience
The Platforms • At CSAR • ‘Green’: Origin 3000, 400MHz MIPS R12000 processors, 1GB memory/processor ie 512 GB memory in total • ‘Turing’: Cray T3E, 816 600MHz processors, 256MB memory/processor ie 209 GB memory in total • At ECMWF • IBM P690: 2x30 P690 nodes, 32 1.3GHz processors/node ie 16 POWER4 chips/node. Each node divided into 4 LPARs, most P690 nodes have 32 GB memory, 2x3 have 128 GB. SPSwitch2 connects LPARs. Supercomputing, Visualization & eScience
The Model Version • All experiments performed at version 5.3 ‘the new dynamics’ • Semi-Lagrangian dynamics • Semi-implicit physics • Non-hydrostatic • Arakawa C-grid • Charney-Phillips grid in the vertical • Must have even number of procs in x direction Supercomputing, Visualization & eScience
Global Runs • N216 ie 432x325 points in the horizontal • 38 vertical levels • 20 minute timestep • Simulation run for 1 day ie 72 timesteps • 5 point halos in both directions • Up to 256 processors used (144 on the IBM) • Fast solver used • MPI used for communication Supercomputing, Visualization & eScience
Mesoscale Runs • Mes covers the UK, parts of Northern Europe and Scandinavia • 146x182 points in the horizontal • 38 vertical levels • 5 minute timestep • Simulation run for 36 hours ie 432 timesteps Supercomputing, Visualization & eScience
Mesoscale Runs • 5 point halos in both directions • 8 points for merging lbcs with main field • Up to 120 processors used • Limited to 10 procs max east-west and 13 procs max north-south • MPI used for communication Supercomputing, Visualization & eScience
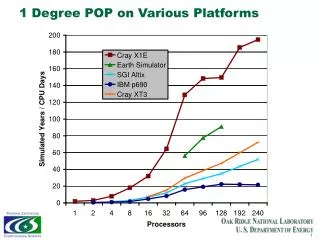
Global Results • T3E required minimum of 24 processors so comparisons are against this value • At lower processor numbers, the Origin 3000 proves to be the most scalable • Above ~156 processors, the T3E overtakes the Origin • The IBM is the least scalable but only run up to 144 processors (normally using < 8 cpus/LPAR – discussed later) • Curve showing IBM results by LPAR show scalability tailing off above 4 LPARs Supercomputing, Visualization & eScience
Global Results Supercomputing, Visualization & eScience
General Comments on the Global Results • Up to 144 processors, normally better to use 4 processors in the east-west direction • Below 32 processors for the IBM, results more varied – sometimes 2 is better • Origin between 1.33 and 1.63 times faster than the T3E • IBM between 2.36 and 3.07 times faster than the T3E Supercomputing, Visualization & eScience
Global Results Supercomputing, Visualization & eScience
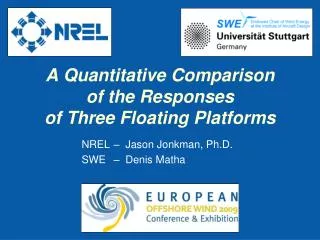
Mesoscale Results • T3E required minimum of 8 processors so comparisons are against this value • Up to 48 processors the IBM out performs the other two machines (using < 8cpus/LPAR – discussed later) • Above ~64 processors, the T3E has the greatest scalability • Curve showing IBM results by LPAR show scalability tailing off above 4 LPARs (using all 8 cpus/LPAR) Supercomputing, Visualization & eScience
Mesoscale Results Supercomputing, Visualization & eScience
General Comments on the Mesoscale Results • For the T3E, better to use fewer processors in EW direction • For the Origin, below 36 processors use 2 or 4 procs in the EW direction. For 36 procs and above use 6 or even 8 • For the IBM, below 24 processors, use more procs in the north-south direction than the east-west. For 24 and above, reverse this Supercomputing, Visualization & eScience
General Comments on the Mesoscale Results • Origin between 1.30 and 1.65 times faster than the T3E • IBM between 1.93 and 3.82 times faster than the T3E • The dip in the results on the IBM at 64 processors is due to having to use 8 procs/LPAR rather than 6 (discussed later) Supercomputing, Visualization & eScience
Mesoscale Results Supercomputing, Visualization & eScience
Discussion about the IBM • For a given processor configuration, results indicate that it is better to use < 8 tasks/LPAR • If you are charged by the number of LPARs used then it is faster to use all the processors on the LPAR (ie increase the configuration) • Eg For a configuration of 4x9, use 6 LPARs (ie 6 tasks/LPAR) • However, if you are using 6 LPARs, the run will be faster using a 4x12 configuration. But 4x12 will produce faster results on 8 LPARs rather than 6. Supercomputing, Visualization & eScience
Discussion about the IBM Supercomputing, Visualization & eScience
Conclusions • The amount of time spent on optimising the UM for use with the T3E is clearly reflected in the results • Further work needs to be done to optimise the code adequately for the Origin and the IBM • The processor configuration for the IBM may be dependent on the charging mechanism Supercomputing, Visualization & eScience
Conclusions • For a given configuration, using < 8 tasks/LPAR will produce faster results • On all machines, it is generally better to use as few processors in the east-west direction as possible Supercomputing, Visualization & eScience
Further Work • Optimisations for the Origin and the P690 • Perform similar tests on the SGI Altix Itanium Supercomputing, Visualization & eScience
SVE @ Manchester Computing World Leading Supercomputing Service, Support and Research Bringing Science and Supercomputers Together www.man.ac.uk/sve sve@man.ac.uk Thanks to ECMWF