Download
1 / 14
150 likes | 325 Views
DEMOGRAPHY AND MIGRATION. POPULATION OF POLAND. EDUCATION SYSTEM OF POLAND. SYSTEM OF EDUCATION IN POLAND. NUMBER OF STUDENTS IN DIFFERENT TYPES OF SCHOOLS IN THOUSANDS IN 2009 PRIMARY SCHOOLS 2294 LOWER SECONDARY SCHOOLS 1381 BASIC VOCATIONAL SCHOOLS 247

E N D
DEMOGRAPHY AND MIGRATION
SYSTEM OF EDUCATION IN POLAND NUMBER OF STUDENTS IN DIFFERENT TYPES OF SCHOOLS IN THOUSANDS IN 2009 PRIMARY SCHOOLS 2294 LOWER SECONDARY SCHOOLS 1381 BASIC VOCATIONAL SCHOOLS 247 GENERAL SECONDARY SCHOOLS 688 SPECIALIZED SECONDARY SCHOOLS 72 TECHNICAL SECONDARY SCHOOLS 568 POST-SECONDARY SCHOOLS 344 TERTIARY EDUCATION 1927
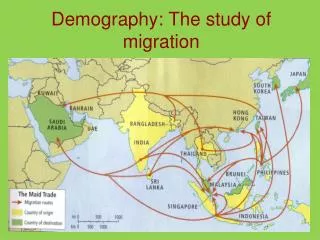
THE MEANING OF „MIGRATION” Migration, emigration, imigration- migration of people in order to change the place of a stay.
MOTIVES OF MIGRATION Source: Bank Światowy, Migration and Remittances, Easter Europe and Soviet Union, 2006
MIGRATION OF POLES • Migrationfrom Poland after 1st May 2004: • Great Britain-> theestimatednumber of Polesbeforejoining EU (AROUND 70 000 IN 2003) • -WorkersRegistrationScheme data: thenumber of applicantsbetween 1st May 2004and theend of December 2006- 510,000, (307,670 Poles) • - 245,000 National Insurance numbersbetween 2003- 2005 • Ireland -> Personal Public Service numberssystem • - 289,814 PPS numbersgiven to EU8 citizensbetween 1st May 2004 and theend of October 2006
MIGRATION OF POLES AFTER 1ST MAY 2004 – WHAT IS NEW? Austria- this country has adopted a great number of Poles for many years. The legal employment of Poles doesn’t exceed 10,000 people a year and it has maintained at the similar level for the last two yeras. Poles constitute the biggest group of employees from new members of EU (around 40%). Hungarians are on the second position (around 30%). Slovaks and Czechs are on the third and forth place (around 15%). The Czech Republic is the only „new” country of EOG group which attracts a great numer of Polish workers. In 2004 and 2005 the number of Poles working there didn’t exceed 10,000 people, however in 2006 it amounted over 13 thousand people. It prooves the inrease of the interest of Poles in taking up jobs in The Czech Republic, especially in borderland. It is obvious that the biggest group of foreigners working in the Czech Republic are Slovaks (around 100,000 people). There are also a few hundred Hungarians working in the country. Alike Czechs and Hungarians Poles work in the second segment of job market which doesn’t require a good knowledge of the language of a certain country as well as high qualifications. The most popular trades are: building, social services, simple office duties.
FOREIGNERS IN POLAND Basic Information • The most importantfeatures of contemporaryimigration to Poland • a smallscale • cities as a maindestinaion • domination of imigrantsfrom Russia • domination of economicalimigration • domination of temporaryreemigrationsettlementdue to mixedmarriage • big number of irregularimmigration • Registration data: 9,500 in 2004; including 1990-2004: 107,200 • NSP 2002- foreigners who do not have Polish citizenships: 40,600 • Repatriates (around 8,000 in 2005) • Other categories- compare- the table • Very low scale of immigration phenomenon (legal) • difficult to estimate meassures of illegal immigration • statistical data indicating the decrease of interest in Poland as a destination: • decrease of number of permissions for settlement • decrease of the number of aplications for the temporary stay • decrease of the number of permissions for work • decrease of the number of refugees • decrease of the number of deportations • the effect of migration policy or the real process Trends of imigration to Poland
IMMIGRATION TO POLAND 2005 year Permissions for job- trends • UE- 25: 1,579 • Germany - 518 • USA - 452 • Ukraine - 2,697 • Belarus - 610 • Russia - 486 • Vietnam - 1067
TEMPORARY STAY OF IMIGRANTS IN POLAND Source: Bijak i Koryś 2006, Kępińska 2007