Download

1 / 13
140 likes | 312 Views
Spectrometer optics studies and target development for the 208Pb(e,e’p) experiment in Hall A at Jefferson Lab , GUIDO M. URCIUOLI, INFN, Roma, Italy, JUAN CARLOS CORNEJO, Cal. State Univ., Los Angeles, JOAQUIN LOPEZ HERRAIZ, Univ. Complutense de Madrid, JEFFERSON LAB HALL A COLLABORATION.

E N D
Spectrometer optics studies and target development for the 208Pb(e,e’p) experiment in Hall A at Jefferson Lab , • GUIDO M. URCIUOLI, INFN, Roma, Italy, • JUAN CARLOS CORNEJO, Cal. State Univ., Los Angeles, • JOAQUIN LOPEZ HERRAIZ, Univ. Complutense de Madrid, • JEFFERSON LAB HALL A COLLABORATION
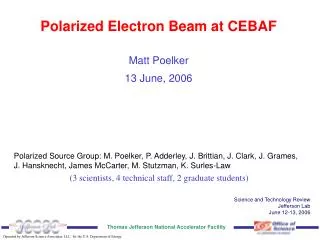
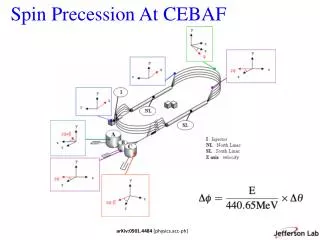
Hall A CEBAF and Hall A at JLab e- source
JLAB Hall AExperimental setup The two High Resolution Spectrometer (HRS) in Hall A @ JLab Beam energy: 4.0, 3.7 GeV sE/E : 2.5 10-5 Beam current: 10 - 100 mA Targets :12C,208Pb, 209Bi Run Time : approx 6 weeks HRS – QQDQ main characteristics: Momentum range: 0.3, 4.0 GeV/c Dp/p (FWHM): 10-4 Momentum accept.: ± 5 % Solid angle: 5 – 6 msr Minimum Angle : 12.5°
HRS Main Design Performaces • Maximum momentum (GeV/c) 4 • Angular range (degree) 12.5-165° • Transverse focusing (y/y0)* -0.4 • Momentum acceptance (%) 9.9 • Momentum dispersion (cm/%) 12.4 • Momentum resolution ** 1*10-4 • Radial Linear Magnification (D/M) 5 • Angular horizontal acceptance (mr) ±30 • Angular vertical acceptance (mr) ±65 • Angular horizontal resolution (mr) ** 0.5 • Angular vertical resolution (mr)** 1.0 • Solid angle (msr) 7.8 • Transverse length acceptance (cm) ±5 • Transverse position resolution (cm) ** 0.1 * (horizontal coordinate on the focal plane)/(target point) ** FWHM
High resolution challenge: Jlab experiment E06-007 Impulse Approximation limitations to the (e,e’p) reaction on 208Pb Identifying correlations and relativistic effects in the nuclear medium K. Aniol, A. Saha, J.M. Udias, G.M. Urciuoli Spokepersons
The goal of the experiment • Use 208Pb, a doubly magic, complex nuclei, a textbook case for the shell model. Measure 208Pb(e,e’p)207Tl cross sections attrue quasielastic kinematics and at both sides of q. This has never been done before for A>16 nucleus • Study low lying states in 207Tl : • g.s. 3s1/2 • 0.351 2d3/2 • 1.348 1h11/2 • 1.683 2d5/2 • 3.470 1g7/2 • Quasielastic kinematics: xB = 1, q = 1 GeV/c , ω = 0.433 GeV/c • Determine momentum distributions: 0 < pmiss < 500 MeV/c • Determine ATL by measuring cross sections on either side of q xB=0.18 Lumjlab/LumNIKHEF-K = 170
Peak Extraction Procedure (GEANT Simulation) Excitation Energy (MeV), pm=100MeV/c To perform a good peak extraction 1 MeV resolution needed
Target Issues and choice • Target Issues: • The target have to withstand currents up to 80 uA • The best comprimise between event statistic ( thick target) and resolution ( thin target) had to be found: • Target choice: • Cold Lead in diamond sandwich • A 0.2 mm lead foil sandwiched between two 0.15 mm diamond foils at cryogenic temperatures • Other target used: • Bismuth • Carbon
METHOD TO IMPROVE THE OPTIC DATA BASE:An optical data base means a matrix T that transforms the focal plane coordinates inscattering coordinates: To change a data base means to find a new matrix T’ that gives a new set of values: : Because: this is perfectly equivalent to find a matrix . you work only with scattering coordinates. From F you simply find T’ by:
METHOD TO IMPROVE THE OPTIC DATA BASE (II) You have: • Expressing: just consider as an example the change in the momentum DP because of the change in the data base: with a polynomial expression Because of the change DPDP’ also the missing energy will change: In this way to optimize a data base you have just to find empirically a polynomial in the scattering coordinates that added to the missing energy improves its resolution : and finally to calculate
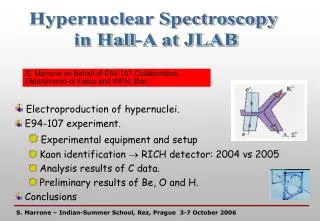
An example: Hypernuclear spectroscopy experiment (E94-107) In the Λ electroproduction on proton (e + p -> e’ + K+ + Λ), The excitation energy appeared a function of the secondary electron and Kaon scattering variables: Exictation energy = Constant + P1(DPe, θe, φe, Ye) + P2(DPk, θk, φk, Yk) With P1(DPe, θe, φe, Ye) + P2(DPe, θe, φe, Ye) are polynomials of the scattered electron and kaon momenta. A good data base should of course get rid of this unphysical behaviour It is straightforward to find the correct data base because : Excitation energy (New data base) = Excitation energy (Old data base) – DM With DM = - P1(DPe, θe, φe, Ye) - P2(DPk, θk, φk, Yk) The right data base should produce the changes δ(DPe), δ(θe), δ(φe), δ(Ye), δ(DPk), δ(θk), δ(φk), δ((Yk) for which: (1)
Optimization Results • Old data base Improved data base 12C(e,e’p)11B Missing energy About 1 MeV resolution Elastic Right arm Elastic Left arm