Download
1 / 4
110 likes | 452 Views
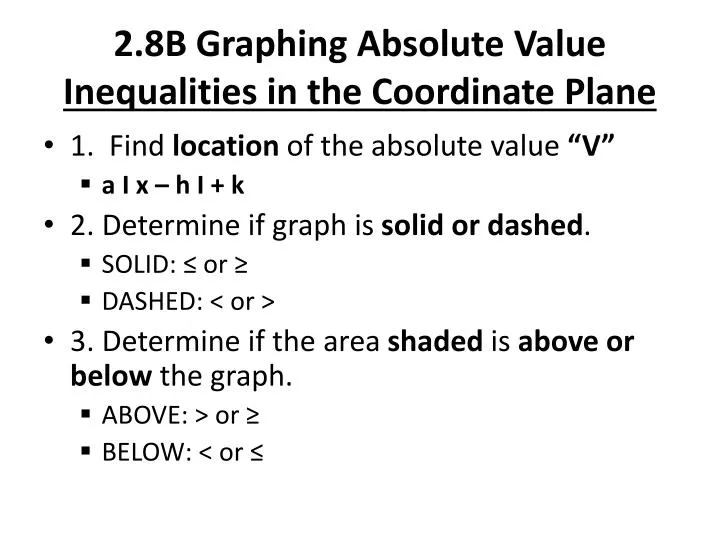
2.8B Graphing Absolute Value Inequalities in the Coordinate Plane. 1. Find location of the absolute value “V” a I x – h I + k 2. Determine if graph is solid or dashed . SOLID: ≤ or ≥ DASHED: < or > 3. Determine if the area shaded is above or below the graph. ABOVE: > or ≥

E N D
2.8B Graphing Absolute Value Inequalities in the Coordinate Plane • 1. Find location of the absolute value “V” • a I x – h I + k • 2. Determine if graph is solid or dashed. • SOLID: ≤ or ≥ • DASHED: < or > • 3. Determine if the area shaded is above or below the graph. • ABOVE: > or ≥ • BELOW: < or ≤
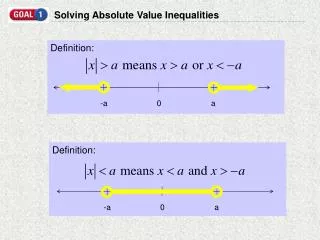
Determine if a point is a solution • Is (x, y) a solution? Put x and y values into original inequality. If result is a TRUE statement, then it is a solution. • Graph inequality. Is the point in the shaded area? If yes, it is a solution.
Examples: Graph each • Y > -2 I x – 3 I + 4 • Y ≥ - I x + 3 I – 2 • Y < 3 I x – 1 I – 3
More Examples • Are the given ordered pairs solutions? • 1.) y ≥ x + a) (-6,8) b) (-3,-3) • 2.) 0.2x + 0.7y > -1 a) (0.5, -1) b) (-3, -1.5)