Download
1 / 34
390 likes | 665 Views
Graphing Absolute Value Equations. 2.8. Let’s explore something. Graph the equation using a table of values. Vertex. Steps to Sketching the graph. To sketch the graph of use the following steps

E N D
Let’s explore something • Graph the equation using a table of values. Vertex
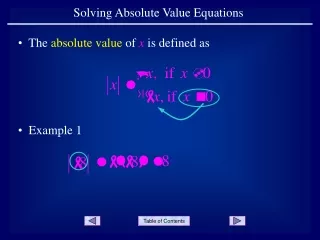
Steps to Sketching the graph • To sketch the graph of use the following steps • Find the x-coordinate of the vertex by finding the value for x for which x – h = 0. • Construct a table of values, using the x-coordinate of the vertex, some x-values to its left, and some to its right. • Plot the points given in the table. Connect the points with a V-shaped graph.
Let’s do an example together • Sketch the graph of .
Let’s Talk • Can we make a rule?
Let’s Talk • Can we make a rule?
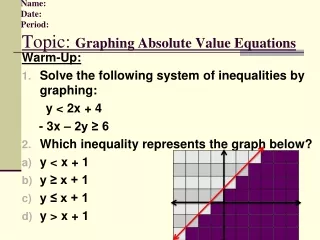
Write an equation for a function whose graph fits the given description The graph of is shifted 4 units right. The graph of is shifted 3 units left and 6 down. The graph of is shifted 2 units right and 5 up.
Homework • “Graphing Absolute Value Functions Day 1” Worksheet
Let’s Talk • Can we make a rule?
So what are the roles of the different coefficients and constants
and DILATION: If we multiply a function by a non-zero real number it has the effect of either stretching or compressing the function because it causes the function value (the y value) to be multiplied by that number. Let's try some functions multiplied by non-zero real numbers to see this.
Vertical Stretch • When you are stretching (or compressing) a function vertically, the general equation for this, if it is y=f(x), would be: y=af(x) • If 'a' is greater than one in the equation, then the equation gets stretched by a factor of 'a'.
Vertically Compression • When you are compressing (or stretching) a function vertically, the general equation for this, if it is y=f(x), would be: y=af(x) • If 'a' is less than one and also greater than zero in the equation, then the equation gets compressed by a factor of 'a'.
Notice for any x on the graph, the new (red) graph has a y value that is 2 times as much as the original (blue) graph's y value. Notice for any x on the graph, the new (green) graph has a y value that is 4 times as much as the original (blue) graph's y value. So the graph af(x), whereais any real number GREATER THAN 1, is the graph of f(x) but vertically stretched or dilated by a factor of a. Above is the graph of What would2f(x) look like? What would4f(x) look like?
What if the value of a was positive but less than 1? So the graph af(x), whereais 0 < a < 1, is the graph of f(x) but vertically compressed or dilated by a factor of a. Notice for any x on the graph, the new (red) graph has a y value that is 1/2 as much as the original (blue) graph's y value. Notice for any x on the graph, the new (green) graph has a y value that is 1/4 as much as the original (blue) graph's y value. Above is the graph of What would1/2 f(x) look like? What would1/4 f(x) look like?
Summary of Transformations So Far **Do reflections and dilations BEFORE vertical and horizontal translations** If a > 1, then vertical dilation or stretch by a factor of a If 0 < a < 1, then vertical dilation or compression by a factor of a If a < 0, then reflection about the x-axis (as well as being dilated by a factor of a) vertical translation of k f(-x) reflection about y-axis horizontal translation of h(opposite sign of number with the x)
Horizontally Stretch • When you are stretching (or compressing) a function horizontally, the general equation for this, if it is y=f(x), would be: y=f(bx) • If 'b' is less than one and greater than zero in the equation, then the equation gets stretched by a factor of 1/b.
Horizontal Compression • When you are compressing (or stretching) a function horizontally, the general equation for this, if it is y=f(x), would be: y=f(bx) • If 'b' is greater than one in the equation, then the equation gets compressed by a factor of 1/b.
What if the value of a was negative? So the graph -f(x) is a reflection about the x-axis of the graph of f(x). (The new graph is obtained by "flipping“ or reflecting the function over the x-axis) Notice any x on the new (red) graph has a y value that is the negative of the original (blue) graph's y value. Above is the graph of What would- f(x) look like?
There is one last transformation we want to look at. So the graph f(-x) is a reflection about the y-axis of the graph of f(x). (The new graph is obtained by "flipping“ or reflecting the function over the y-axis) Notice any x on the new (red) graph has an x value that is the negative of the original (blue) graph's x value. Above is the graph of What would f(-x) look like? (This means we are going to take the negative of x before putting in the function)
The rules and what they mean: This is our function This is our function vertically stretched This is our function vertically compressed This is our function horizontallycompressed This is our function horizontallystretched This is our function reflected over the x-axis This is our function reflected over the y-axis
Homework • Worksheet