Download
1 / 1
20 likes | 125 Views
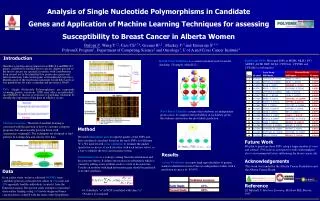
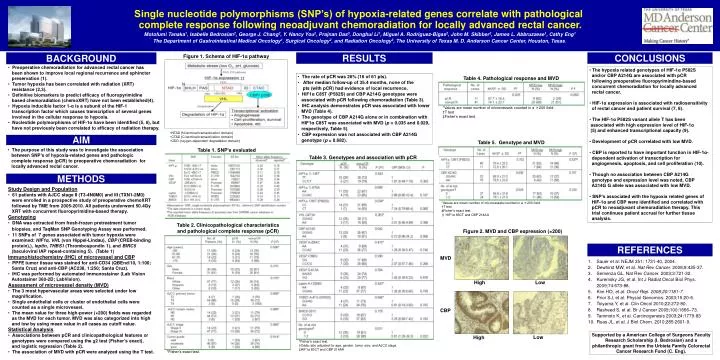
Single nucleotide polymorphisms (SNP’s) of hypoxia-related genes correlate with pathological complete response following neoadjuvant chemoradiation for locally advanced rectal cancer.

E N D
Single nucleotide polymorphisms (SNP’s) of hypoxia-related genes correlate with pathological • complete response following neoadjuvantchemoradiation for locally advanced rectal cancer. • Motofumi Tanaka1, Isabelle Bedrosian2, George J. Chang2, Y. Nancy You2, Prajnan Das3, Donghui Li1, Miguel A. Rodriguez-Bigas2, John M. Skibber2, James L. Abbruzzese1, Cathy Eng1 • The Department of Gastrointestinal Medical Oncology1, Surgical Oncology2, and Radiation Oncology3, The University of Texas M. D. Anderson Cancer Center, Houston, Texas. BACKGROUND Figure 1. Schema of HIF-1α pathway RESULTS CONCLUSIONS • Preoperative chemoradiation for advanced rectal cancer has been shown to improve local regional recurrence and sphincter preservation (1). • Tumor hypoxia has been correlated with radiation (XRT) resistance (2,3). • Definitive biomarkers to predict efficacy of fluoropyrimidine • based chemoradiation (chemoXRT) have not been established(4). • Hypoxia inducible factor 1-α is a subunit of the HIF-1 transcription factor which causes transcription of several genes involved in the cellular response to hypoxia. • Nucleotide polymorphisms of HIF-1α have been identified (5, 6), but have not previously been correlated to efficacy of radiation therapy. • The hypoxia related genotypes of HIF-1α P582S • and/or CBP A214G are associated with pCR • following preoperative fluoropyrimindine-based • concurrent chemoradiation for locally advanced • rectal cancer. • HIF-1α expression is associated with radiosensitivity • of rectal cancer and patient survival (7, 8). • The HIF-1α P582S variant allele T has been • associated with high expression level of HIF-1α • (5) and enhanced transcriptional capacity (9). • Development of pCR correlated with low MVD. • CBP is reported to have important function in HIF-1α- • dependent activation of transcription for • angiogenesis, apoptosis, and cell proliferation (10). • Though no association between CBP A214G • genotype and expression level was noted, CBP • A214G G allele was associated with low MVD. • SNP’s associated with the hypoxia related genes of • HIF-1α and CBP were identified and correlated with • pCR to neoadjuvant chemoradiation therapy. This • trial continues patient accrual for further tissue • analysis. • The rate of pCR was 26% (16 of 61 pts). • After median follow-up of 35.4 months, none of the • pts (with pCR) had evidence of local recurrence. • HIF1α C85T (P582S) and CBP A214G genotypes were • associated with pCR following chemoradiation (Table 3). • IHC analysis demonstrates pCR was associated with lower • MVD (Table 4). • The genotype of CBP A214G alone or in combination with • HIF1α C85T was associated with MVD (p = 0.035 and 0.029, • respectively, Table 5). • CBP expression was not associated with CBP A214G • genotype (p = 0.682). Table 4. Pathological response and MVD *Values are mean number of microvessels counted in a ×200 field. †T test ‡Fisher’s exact test. • NTAD (N-terminal transactivation domain) • CTAD (C-terminal transactivation domain) • ODD (oxygen-dependent degradation domain) AIM Table 5. Genotype and MVD • The purpose of this study was to investigate the association • between SNP’s of hypoxia-related genes and pathologic • complete response (pCR) to preoperative chemoradiation for • locally advanced rectal cancer. Table 1. SNP’s evaluated Table 3. Genotypes and association with pCR METHODS • Study Design and Population • 61 patients with AJCC stage II (T3-4N0M0) and III (TXN1-2M0) • were enrolled in a prospective study of preoperative chemoXRT • followed by TME from 2005-2010. All patients underwent 50.4Gy • XRT with concurrent fluoropyrimidine-based therapy. • Genotyping • DNA was extracted from fresh-frozen pretreatment tumor • biopsies, and TaqMan SNP Genotyping Assay was performed. • 11 SNPs of 7 genes associated with tumor hypoxia were • examined: HIF1α, VHL (von Hippel-Lindau), CBP (CREB-binding • protein),), leptin, THBS1 (Thrombospondin 1), and BIRC5 • (baculoviral IAP repeat-containing 5). (Table 1) Immunohistochemistry (IHC) of microvessel and CBP • PPFE tumor tissue was stained for anti-CD34 (QBEnd/10, 1:100; • Santa Cruz) and anti-CBP (AC238, 1:250; Santa Cruz). • IHC was performed by automated immunostainer (Lab Vision • Autostainer 360-2D; LabVision). Assessment of microvessel density (MVD) • The 3 most hypervascular areas were selected under low • magnification. • Single endothelial cells or cluster of endothelial cells were • counted as a single microvessel. • The mean value for three high-power (×200) fields was regarded • as the MVD for each tumor. MVD was also categorized into high • and low by using mean value in all cases as cutoff value. Statistical Analysis • Associations between pCR and clinicopathological features or • genotypes were compared using the χ2 test (Fisher’s exact), • and logistic regression (Table 2). • The association of MVD with pCR were analyzed using the T test. *Values are mean number of microvessels counted in a ×200 field. †T test ‡Fisher’s exact test. §HIF1α 85CT and CBP 214AA Table 2. Clinicopathological characteristics and pathological complete response (pCR) Figure 2. MVD and CBP expression (×200) REFERENCES MVD • Sauer et al: NEJM 351: 1731-40, 2004. • Dewhirst MW, et al. Nat Rev Cancer. 2008;8:425-37. • Semenza GL.Nat Rev Cancer. 2003;3:721-32. • Kuremsky JG, et al. Int J Radiat Oncol Biol Phys. 2009;74:673-88. • Kim HO, et al. Oncol Rep. 2008;20:1181-7. • Prior SJ, et al. Physiol Genomics. 2003;15:20-6. • Toiyama Y, et al. Clin Oncol 2010;22:272-80. • Rasheed S, et al. Br J Cancer 2009;100:1666–73. • Tanimoto K, et al. Carcinogenesis 2003;24:1779-83 • Ruas JL, et al. J Biol Chem. 2010;285:2601-9. High Low CBP Supported by a American College of Surgeons Faculty Research Scholarship (I. Bedrosian) and a philanthropic grant from the Urbieta Family Colorectal Cancer Research Fund (C. Eng). Low High *Fisher’s exact test. †Odds ratio adjusted for age, gender, tumor size, and AJCC stage. ‡HIF1α 85CT and CBP 214AA *Fisher’s exact test.