Download

1 / 25
250 likes | 406 Views
The State of Suretyship and US Economic Issues. September 26th, 2013 Bob Bubnick Senior Account Executive Zurich Surety, Credit and Political Risk bob.bubnick@zurichna.com 330.241.7150. Presentation Overview. The 3 C’s of Surety Market Trends Current Economic Issues Conclusions.

E N D
The State of Suretyship and US Economic Issues September 26th, 2013 Bob Bubnick Senior Account Executive Zurich Surety, Credit and Political Risk bob.bubnick@zurichna.com 330.241.7150
Presentation Overview The 3 C’s of Surety Market Trends Current Economic Issues Conclusions
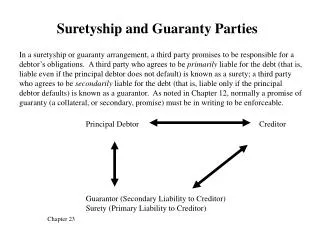
The State of Suretyship • The 3 C’s of Suretyship • Capital • Capacity • Character
Capital • Status of Accounts Receivable • Collection issues derived from overall economy • Owners are having issues therefore slow to pay • Verification of financing becomes critical • Other receivables being evaluated so as to determine collectability and intent. • Shareholder Receivables…..are they equity or an item that should have been expensed?
Capital • Asset quality being scrutinized more than ever. • Underbillings • What is the cause of the underbilling? • Timing issues? • Unapproved change orders? • Have the underbillings caught up? • Billed yet? • Collected?
Capacity • Capacity is the Art of Suretyship • The underwriter’s ability to illustrate a contractor’s ability, experience and expertise. • Construction Reform in Ohio • Paper GC vs Mainline GC vs CM • Multiprime vs Single Prime • Design, Bid & Build vs Design/Build • The true effects on Ohio domiciled small to medium sized general contractors regardless of discipline.
Capacity • Sophistication level of the Contractor • Internal accounting capabilities • Reliability of the statements and supporting schedules. • Stretching job size and program. 2X’s rule. • Contingency plans • Bank letter’s of credit • Subordinated Debt • Funded Buy/Sell Agreement
Communication • The 4th Communication • Give credit to Stan Kucinski, Westfield field manager for 25 years. • Annual meetings with clients to develop rapport • Interim financial data to compare projections and develop forecast going forward. • Agency calls to follow up and push needed items • Think 3 steps ahead
Marketplace Trends • Top 15 Surety Carriers • Written Premium • Market Share • Loss Ratio
Top 15 Surety Writers and Written Premium 1990SFAA as Source F&D of Maryland (Now Zurich) $137,737,707 USF&G (Now Travelers) $122,339,387 Reliance (Now Travelers) $121,028,201 Aetna Life and Casualty (Now Travelers) $115,421,781 Fireman’s Fund (Now Kemper) $ 96,630,511 Seaboard Surety (Now Travelers) $ 96,022,192 Continental Corporation (Now CNA) $ 96,004,836 CNA Insurance Group $ 83,827,080 AIG (Now Chartis) $ 74,836,632 Safeco Insurance Group (Now Liberty) $ 74,612,101 Hartford Group $ 70,647,159 Chubb Group $ 62,406,525 St. Paul Group (Now Travelers) $ 58,475,045 Cigna Group (Now ACE) $ 55,883,212 Amwest Insurance Group (Out of Business) $ 54,280,637
Top 15 Surety Writers and Written Premium 2012SFAA as Source Travelers $754,242,281 Liberty Mutual Group $725,674,403 Zurich $462,515,514 CNA Insurance Group $411,159,984 Chubb Group $198,597,507 International Fidelity $161,354,957 HCC Surety Group $160,568,163 Hartford Fire and Casualty Group $159,703,913 ACE Ltd. $129,113,588 RLI Insurance Group $110,619,407 Great American Insurance Companies $104,178,304 Lexon Safeguard Insurance Companies $100,935,483 Hanover Insurance group $ 85,681,214 North American Specialty Surety Group (NAS) $ 78,159,662 Merchants Bonding Company $ 72,803,822
Top Surety Writers • In 1990: Market ShareLoss Ratio • The top 5 writers: 27% 5.8% • The top 10 writers: 46% 7.3% • The top 15 writers: 60% 9.1% Top 100 Loss Ratio 14.5% • In 2012: Market ShareLoss Ratio • The top 5 writers: 51% 16.3% • The top 10 writers: 65% 16.9% • The top 15 writers 74% 19.5% Top 100 Loss Ratio 19.0%
Current Economic Issues Profit Margins By Market Sector Gasoline Prices New Home Starts GDP Debt Levels Federal Funds Rate 100 Year Stock market Trends Unemployment Rates
Current Economic IssuesYahoo.com business as source Net Profit Margins
Gasoline Prices zFacts as Source
Drill, Baby, Drill!! Drilling quadruples, Exports triple
New Home Starts Calculated Risk as Source
US GDP Growth Tradingeconomics.com as source
GDP to Total Debt Macrotrends.net as Source
Historical US Federal Funds Rate Source: federalreserve.gov
Dow Jones 100 Year Trend Rydex/SGI as source
Dow Jones 100 Year Trend Rydex/SGI as source
20 Year Unemployment Rate Macrotrends.net as source
Conclusions Surety The National sureties hold a larger market share and have enjoyed better loss experience. The top 15 sureties are poised to capture even more when the market turns. Public funding is still decreasing and new project starts are down by 5% year over year. Those contractors that are still standing today are leaner and more efficient. Credit cases have thinned out due to economic downturn. Many small to medium contractors will face the dilemma of having cash flow stress when programs pick up; They have the capacity to do the work but not the capital. Sureties will have to make smart bets.
ConclusionsEconomy Economic recovery is ongoing and sluggish at best as evidenced by GDP and unemployment rates. Gross margin for market sectors has returned, but confidence is weak. Still a large inventory of homes remaining from 2008 recession effecting new home starts. Gas prices remain high relative to a recovery period. Prolonged Bear Market continues in spite of Quantitative Easing/Digitizing by the FED and historically low interest rates. Unemployment continues to be at record highs following a recovery period. Overall, small to medium sized entrepreneurs continue to sit on the side lines because of poor business climate and uncertainty.